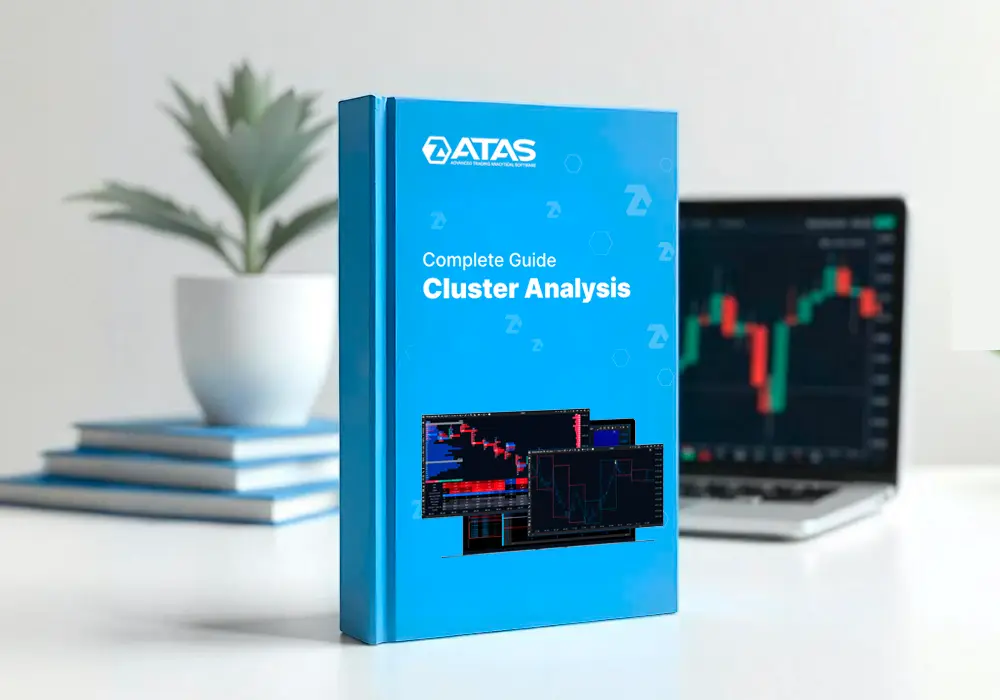
Cluster Analysis: The Complete Guide
Cluster analysis is one of the most accurate methods for evaluating market dynamics.
It reveals the true interaction between supply and demand — something hidden on traditional candlestick charts.
📖 What’s inside?
- Principles of building cluster and footprint charts
- How to read and interpret Bid/Ask, Delta, Volume, and Volume Profile charts
- Practical application: Bid/Ask imbalance, completed and unfinished auctions, volume concentrations, trends, and reversals
- Overview of basic settings: proportional display, filters, candle max volume
📌 This guide makes complex concepts easy to understand. Clear explanations, practical examples, and in-depth analysis will help you confidently apply footprint analysis and identify entry and exit points with precision.
A software development company specializing in volume analysis of stocks, futures, and cryptocurrencies
- Category: Education
- Level: Beginner
- Language: English
- Asset class: Futures, Stocks, Cryptocurrencies

Análisis Footprint: De la Teoría a la Práctica. Cómo entender, interpretar y aplicar clústeres en el trading
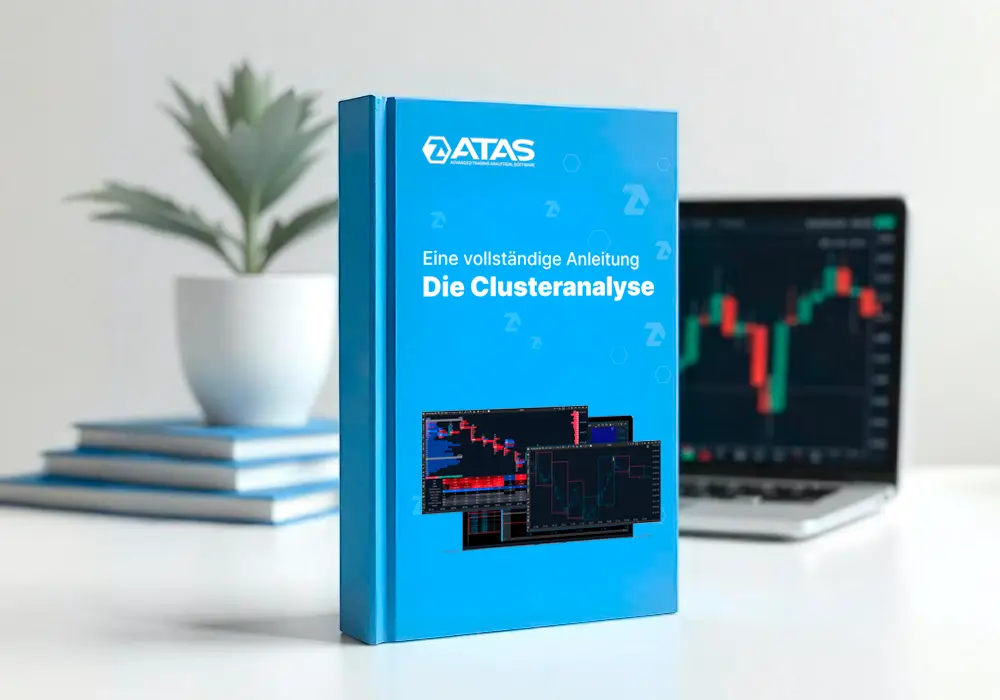
Footprint-Analyse: Von der Theorie zur Praxis. Wie man Cluster im Trading versteht, interpretiert und anwendet
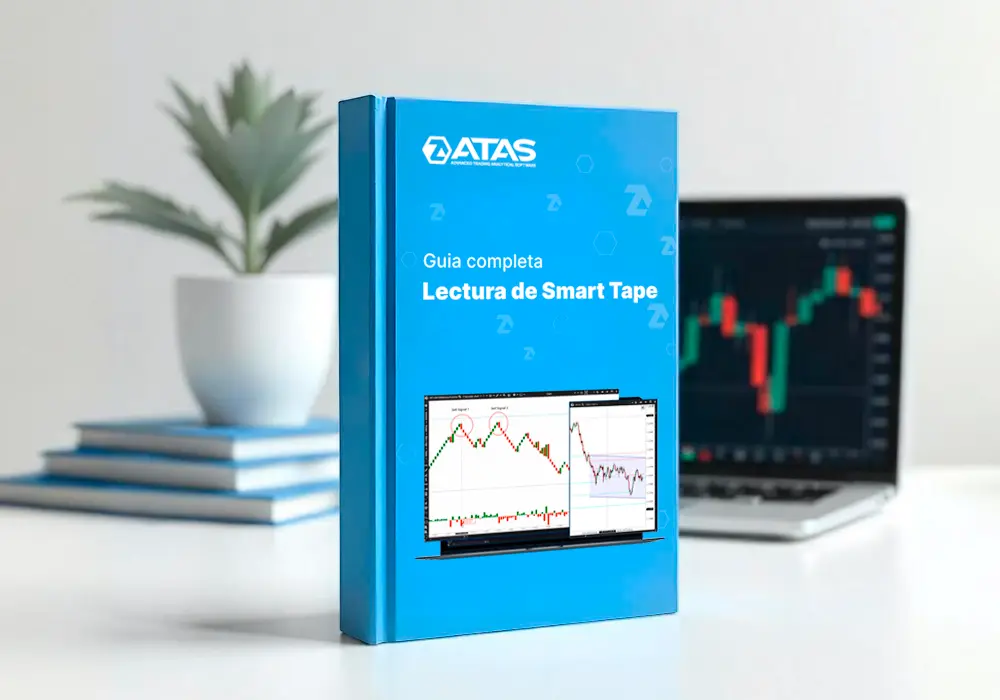
Smart Tape: Algoritmo único y su aplicación. Indicadores basados en la cinta
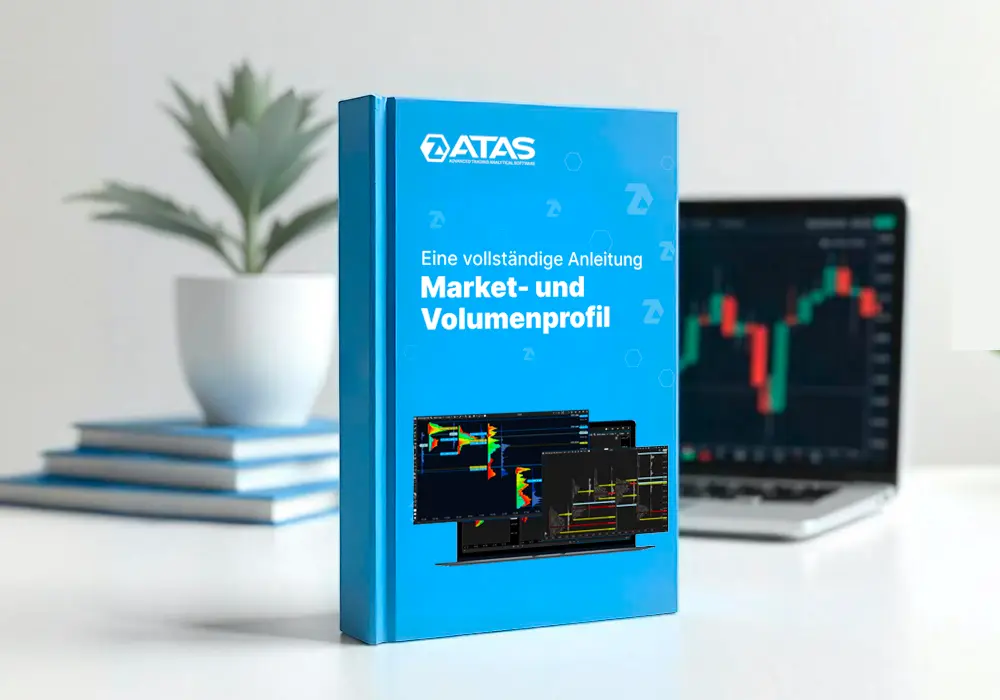
Von der Auktionstheorie zur praktischen Anwendung von Market Profile und Volume Profile
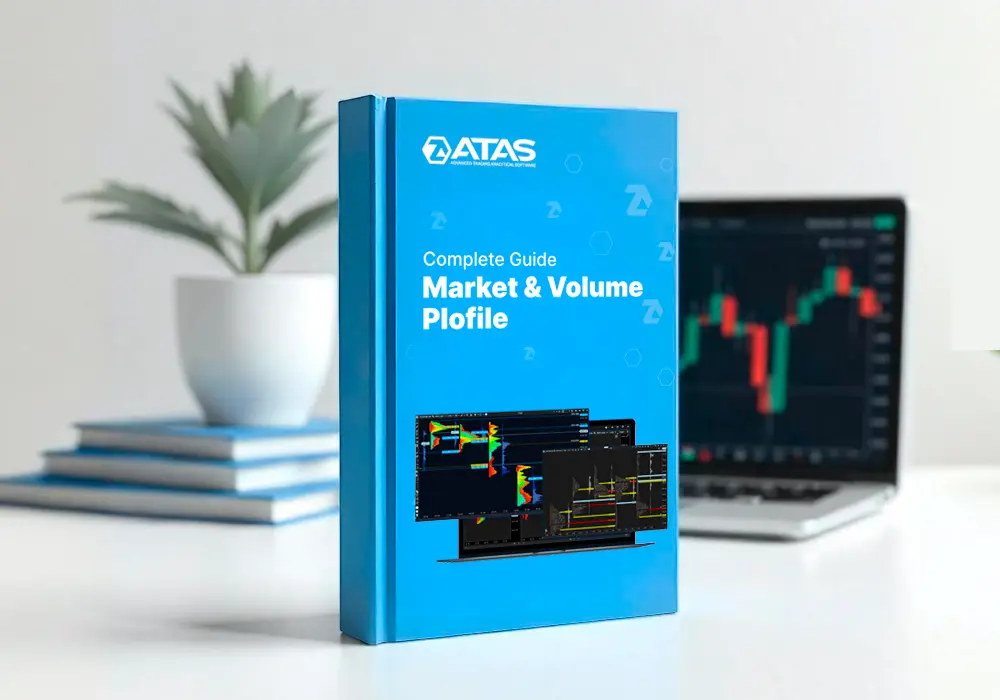
From auction market theory to the practical use of Market Profile and Volume Profile
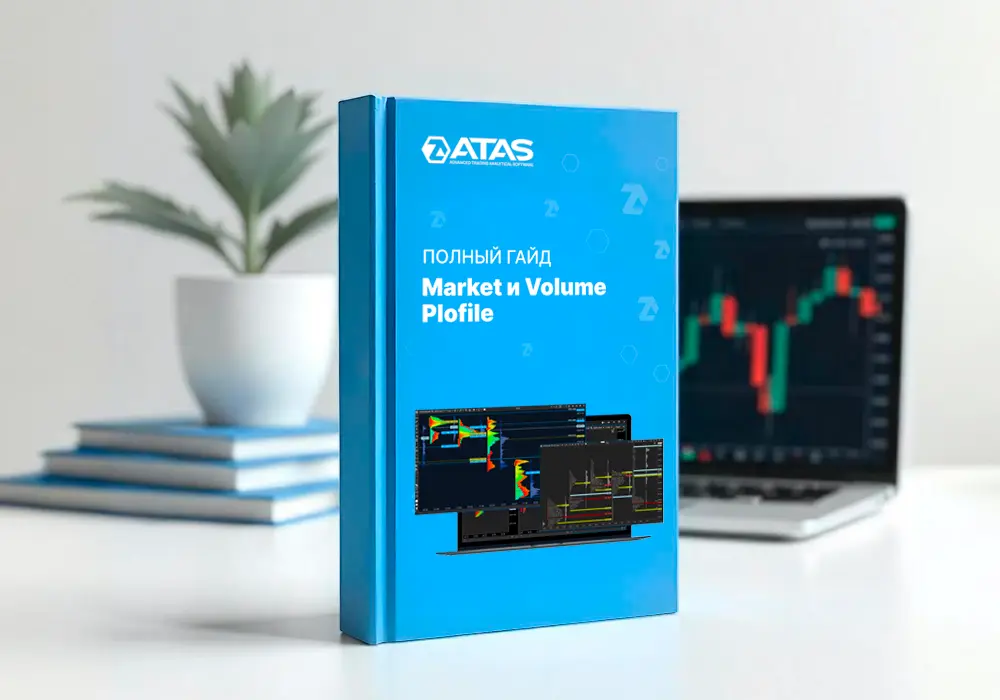
От теории рыночного аукциона к практическому применению Market Profile и Volume Profile.
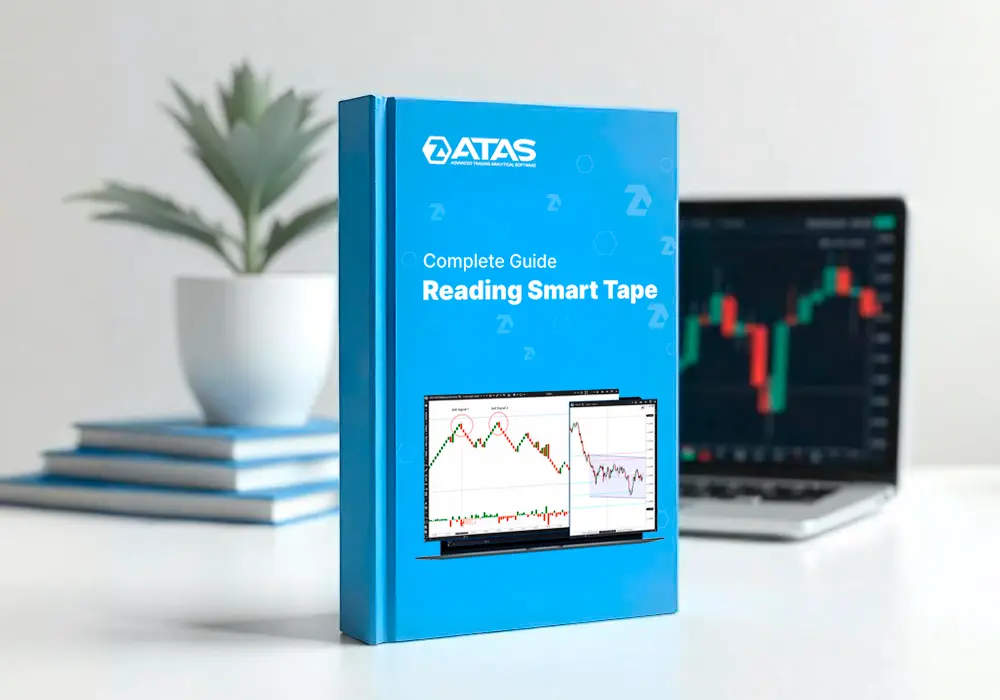
Smart Tape: a unique algorithm and its application. Tape-based indicators
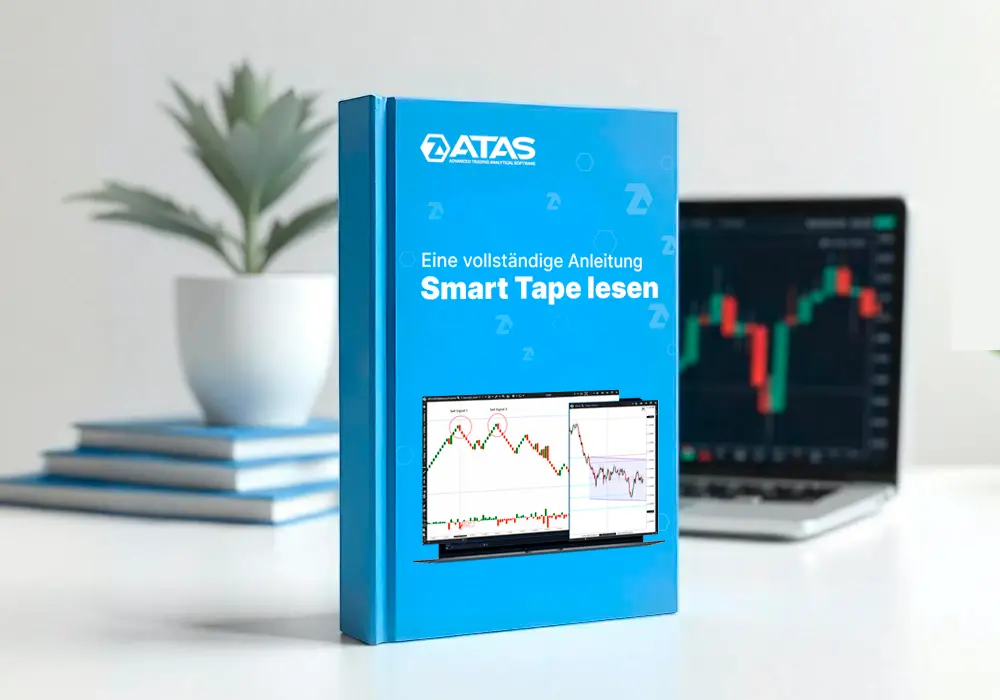
Smart Tape: Einzigartiger Algorithmus und seine Anwendung. Indikatoren auf Basis des Time & Sales
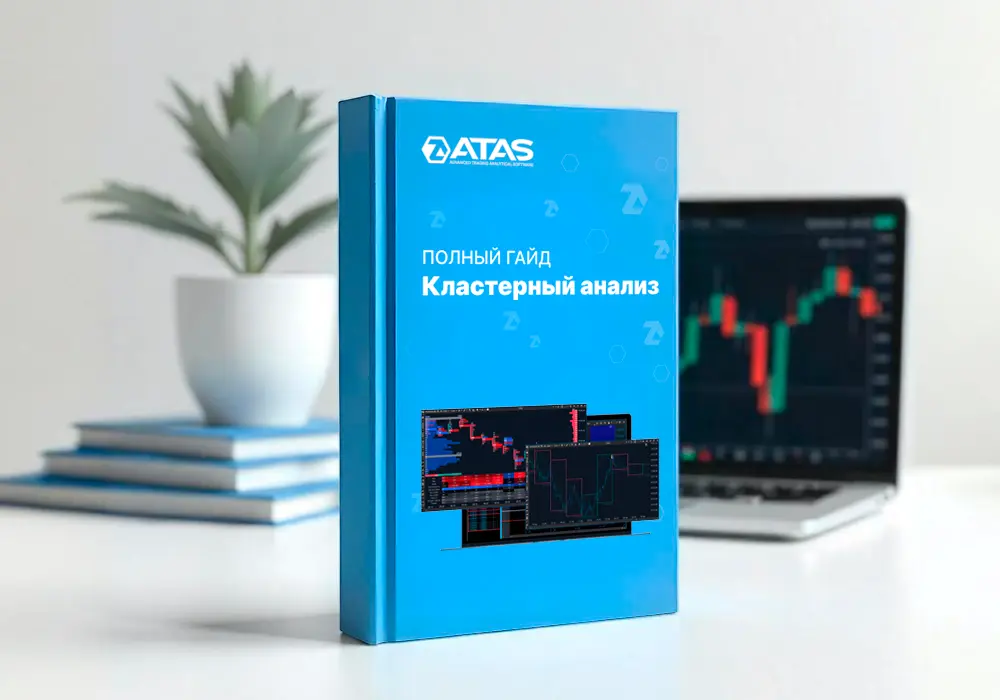
Футпринт-анализ: от теории к практике. Как понимать, интерпретировать и применять кластера в торговле
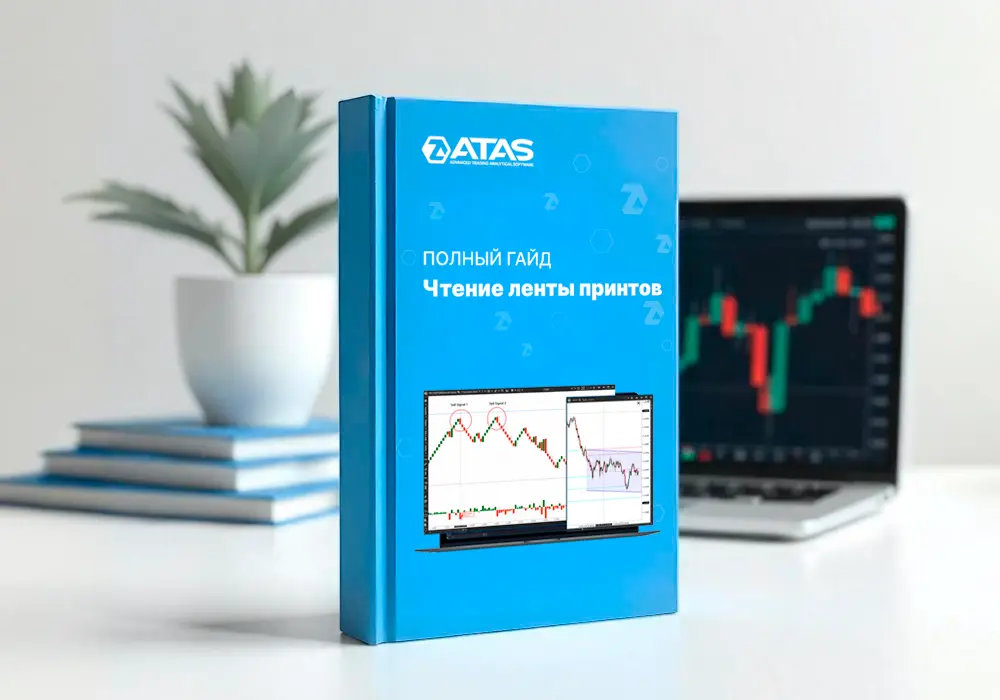
Smart Tape: уникальный алгоритм и его применение, индикаторы на основе ленты принтов
