
Linescope Lite
Description
Information about the vendor
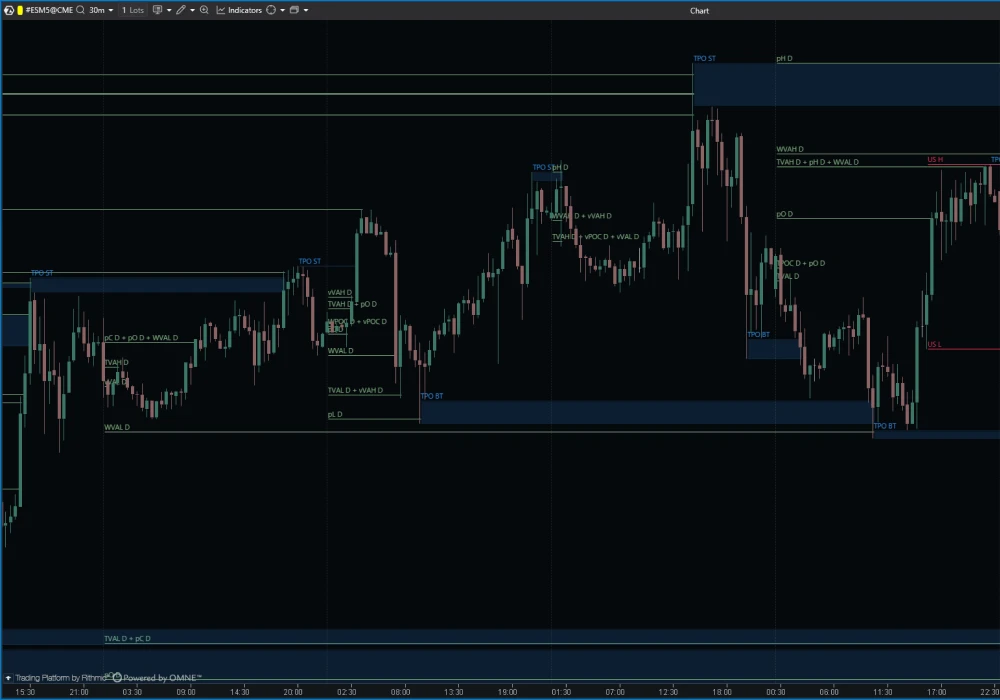
Professional indicators for the ATAS analytical platform that eliminate confusion and deliver the insights you need to trade with confidence. The only indicators that transform advanced trading techniques into simple, actionable signals, designed for traders who demand clarity, precision, and results.
 Publication:20.05.2026
- Category: Algotrading
- Asset class: Futures, Stocks, Forex/CFD, Cryptocurrencies
Price: FREE
Related products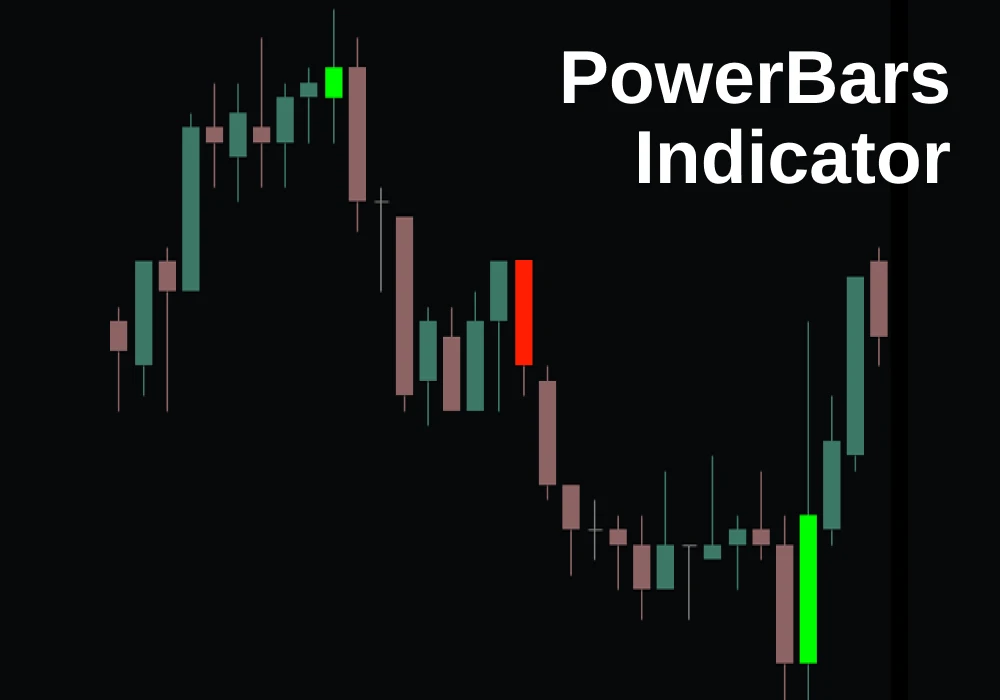 PowerBars Indicator
⚡ PowerBars automatically spots abnormal volume spikes associated with institutional activity — zero configuration, just drop it on your chart and observe large-volume market patterns on any instrument or timeframe.
Category: Indicators
FREE