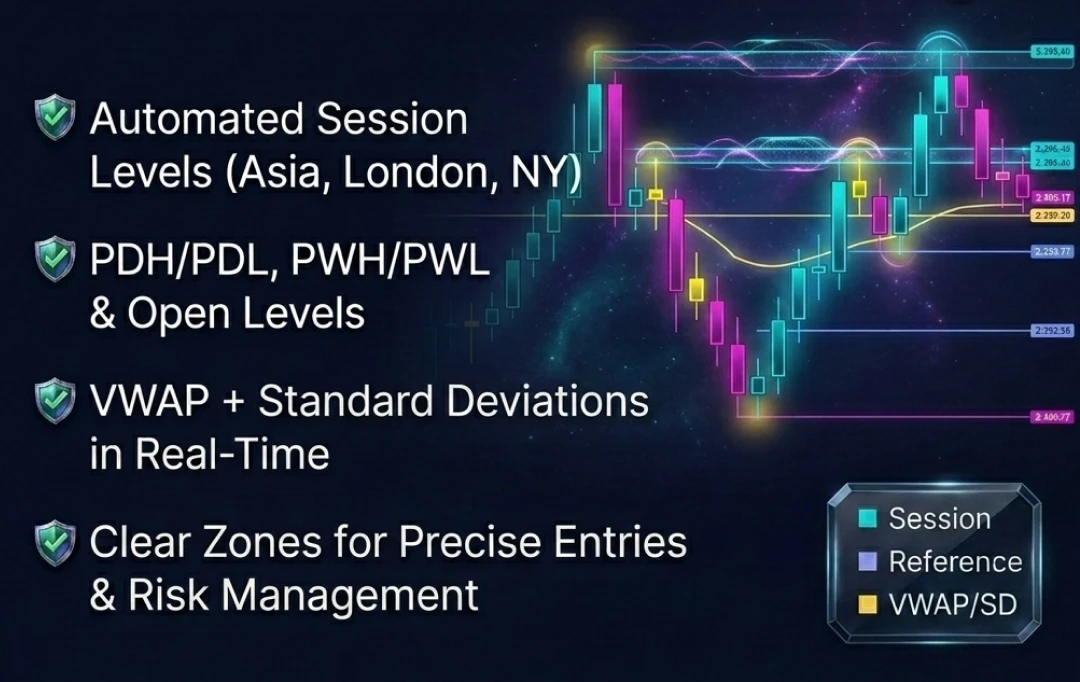
ITW Levels processes incoming bar data and continuously updates several internal level groups.
Session engine — tracks local session windows (Asia, London, New York) using a configurable time offset. Records each session's high/low and updates these extremes while the session is active. Preserves session extremes after close so they remain actionable as reference levels.
Reference levels — computes prior-day, prior-week, prior-month highs/lows. Displays key opens (e.g., daily open, NY open) and current higher-timeframe context levels.
VWAP engine — calculates VWAP cumulatively from price-volume data. Optionally plots standard deviation bands above/below VWAP for stretch/reversion zones. Supports multiple VWAP scopes (e.g., daily and weekly simultaneously).
Rendering — draws horizontal lines at each tracked level and writes labels on the right chart edge for quick scanning. Traders can read market context through interactions with levels:
Users can adjust a wide range of parameters, including:
Intraday breakout context — price breaks London high and retests it as support while holding above daily VWAP; trader evaluates potential continuation.
Mean-reversion analysis — price extends into +2 VWAP SD near prior day high, then prints rejection; trader analyzes potential move back toward VWAP.
Session transition planning — during NY open, trader observes interaction with Asia/London highs/lows to assess liquidity zones and directional context.
Risk placement with structure — long entry above daily open; stop placed below nearest session low; target set at prior week high or VWAP band.
Confluence mapping — when PDH + weekly VWAP + NY session high cluster in a tight range, the zone is treated as a high-importance reaction area.
ITW Innovative Trade Works provides custom development services for analytical indicators and algorithmic tools for ATAS. The team's services include design, implementation, and optimization of order flow tools tailored to client requirements. All work is strictly limited to technical development and does not include financial or investment advice. Additional information and documentation are available upon request.

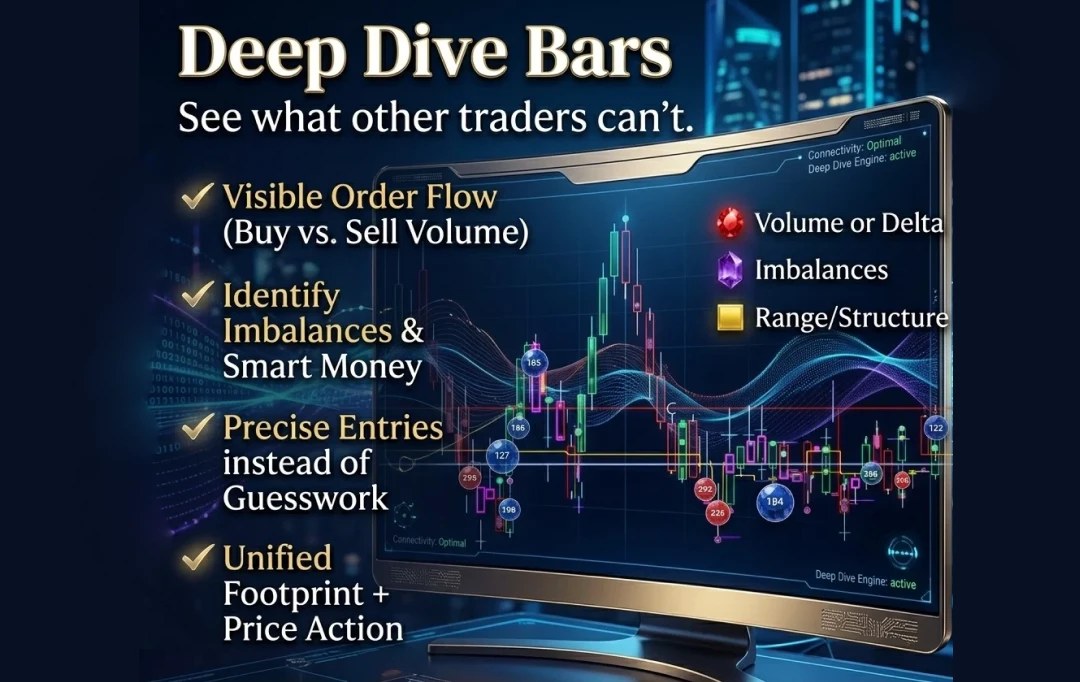
Deep Dive Candles is an advanced candle-analysis indicator for ATAS that reveals momentum strength, exhaustion, and continuation zones — turning complex candle behavior into clear visual context.
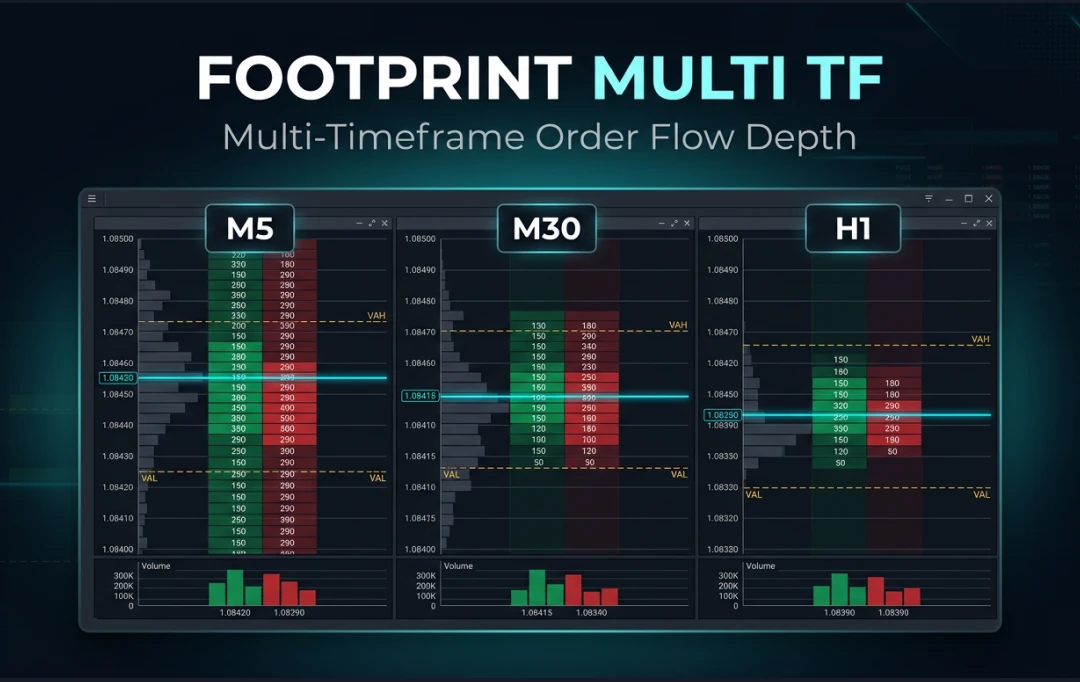
Multi Timeframe Candles is a footprint indicator for ATAS that displays multiple timeframes side by side on one chart — combining candle context, per-level volume and delta, value-area lines, and a bar timer.

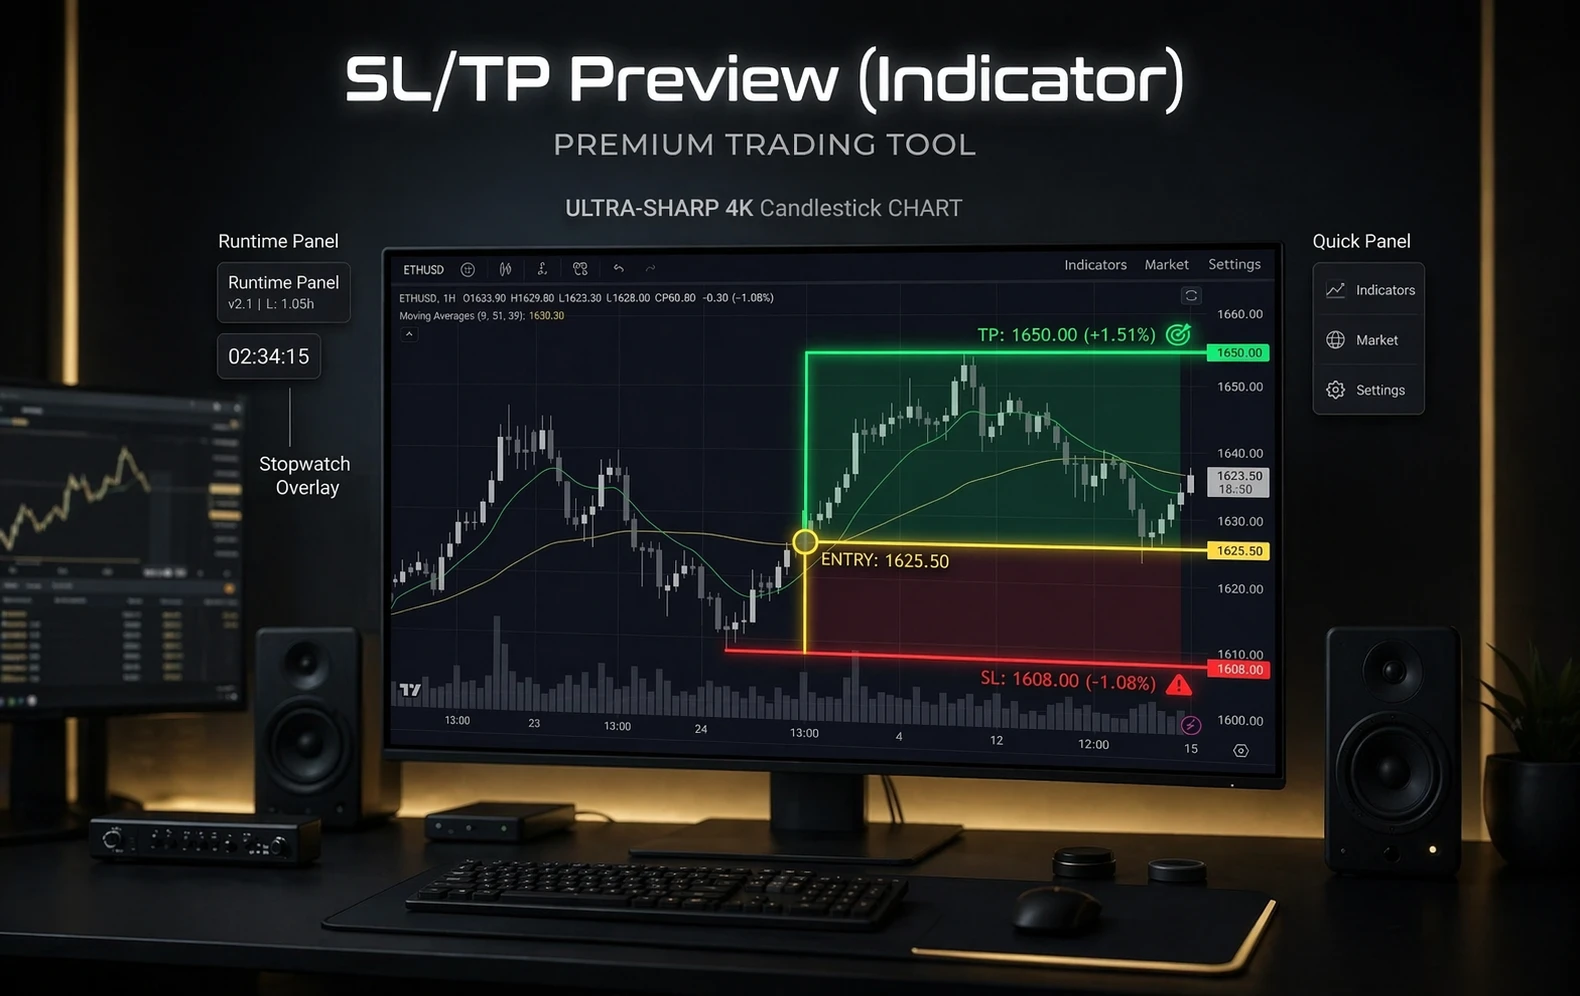
SL/TP Preview is a risk-management indicator for ATAS that visualizes Stop Loss and Take Profit levels directly on the chart — including risk-to-reward ratio — before a position is placed.