
 Publication:17.07.2026
Magic Clusters Suite
- Category: Algotrading
- Asset class: Futures, Stocks, Forex/CFD, Cryptocurrencies
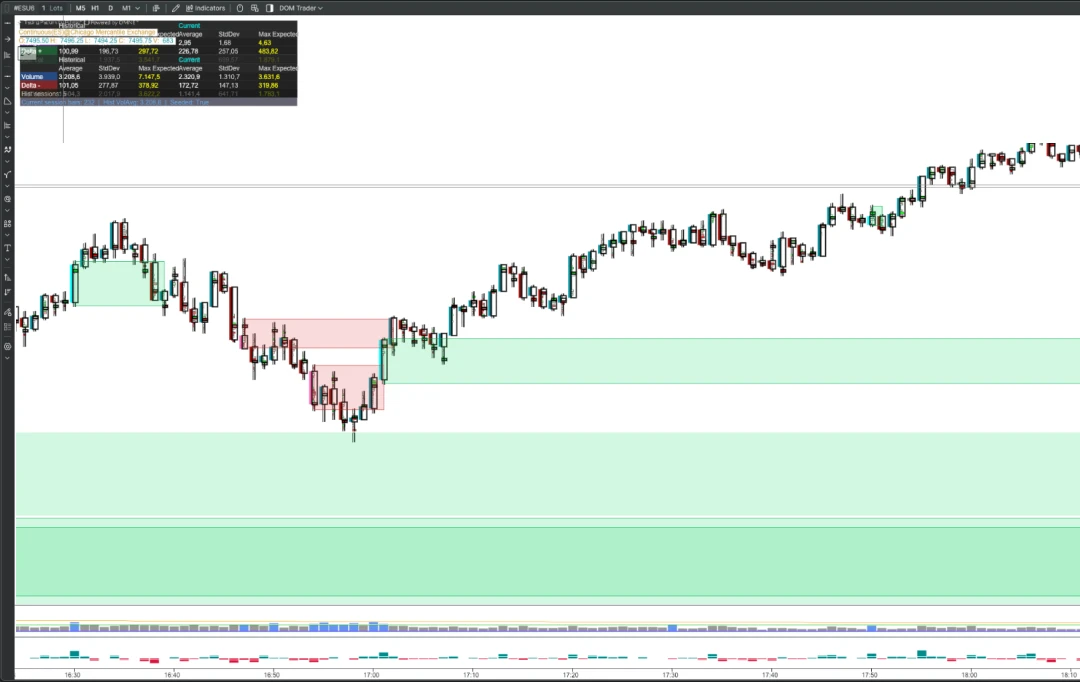
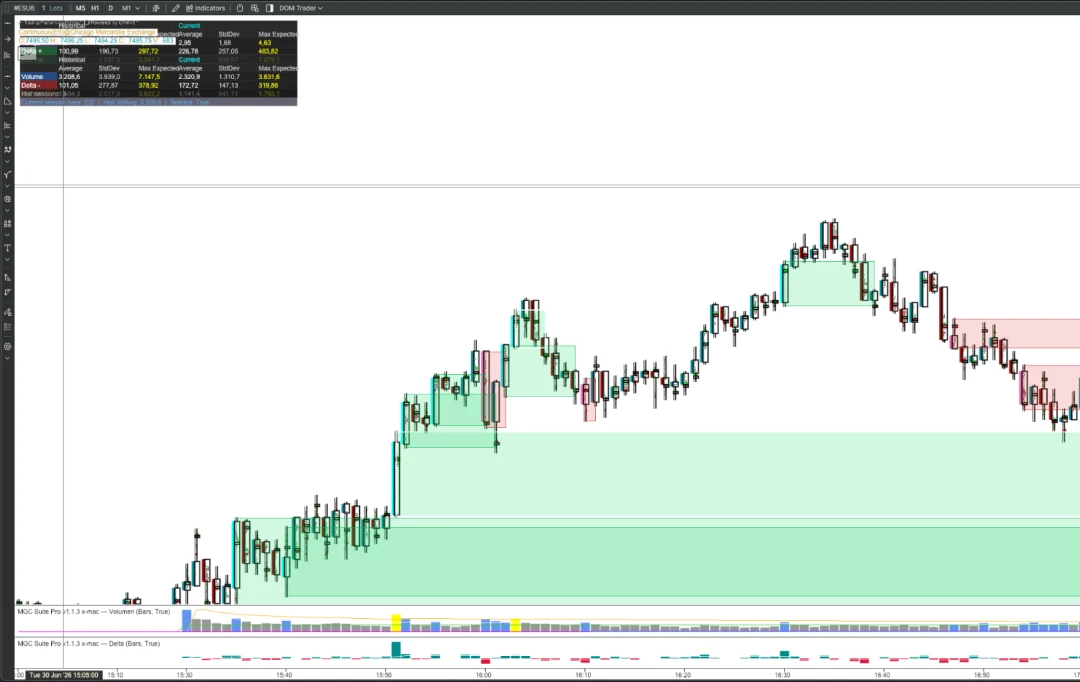
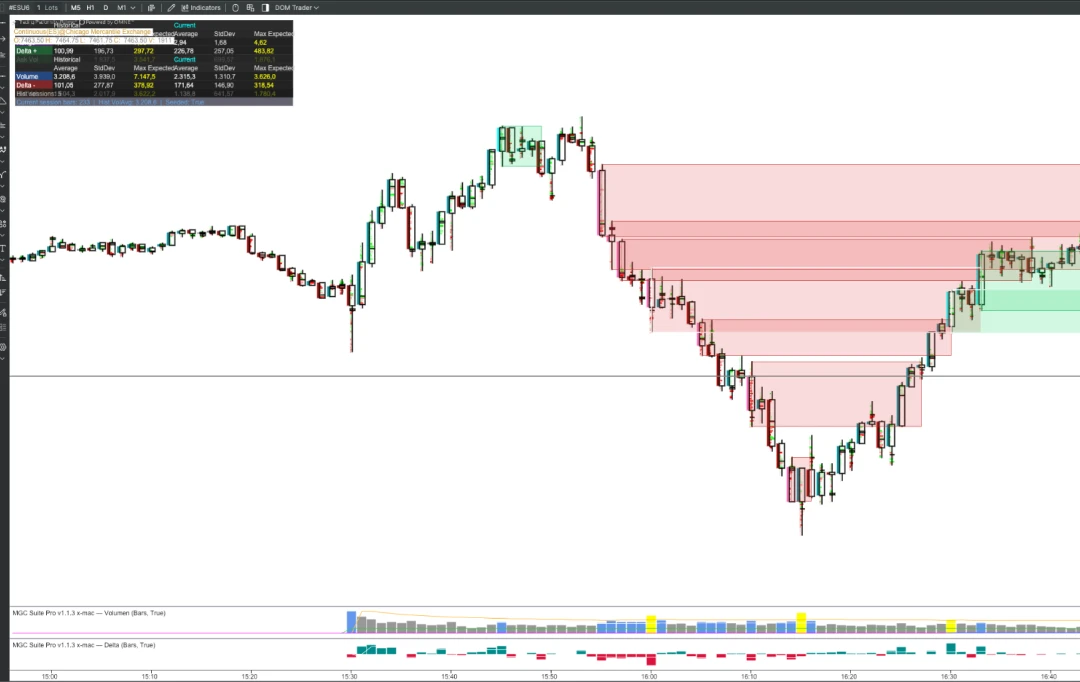
Description
Volume-based / order-flow indicator (footprint volume and delta) with custom zone detection.
Key Features
- Order-flow candle coloring by buying/selling aggression (volume + delta)
- Automatic detection of large-player Bull and Bear zones
- Key Candle and Divergent Candle detection
- Dedicated Volume and Delta sub-panels
- Trend cloud and on-chart statistics table
- Runs on the 1-minute chart
- Coming soon: view the 1-minute zones on any timeframe
- Trading-session scheduling and fully configurable styling
How It Works
The indicator reads the order-flow footprint of each candle on the 1-minute chart — per-price volume, ask/bid, and delta — and aggregates it to measure net buying vs. selling aggression. Candles are colored by that pressure, and key candles and divergences are flagged when price action and delta disagree.
Clusters of significant activity are turned into Bull/Bear zones that are tracked over time, while the Volume and Delta sub-panels show the underlying distribution. An upcoming update will publish those 1-minute zones so they can be viewed, anchored by price and time, on any timeframe.
Customization
Users can adjust zone sensitivity and thresholds, candle colors and styling, the trend cloud, key/divergent candle detection, the statistics table, the trading-session schedule, and per-feature on/off toggles. The indicator currently runs on the 1-minute chart; multi-timeframe viewing of its zones is coming in an upcoming update.
Use Cases
- Watch for large-player accumulation/distribution as Bull/Bear zones form on the 1-minute order flow.
- Factor key candles and delta divergences at those zones into their own entry/exit decisions, rather than treating them as automatic triggers.
- Read net aggression and absorption with the Volume and Delta sub-panels to help assess whether a breakout has real participation behind it.
- Coming soon: carry the 1-minute zones onto higher timeframes for added context.
Magic Clusters builds order flow indicators created exclusively for the ATAS analytics platform, focused on liquidity imbalances, volume-and-delta activity, and accumulation zones in real time. The lineup includes Y_Levels, which maps prior-session structure and untested historical levels, and Magic Cluster Suite, which flags zones where volume and delta move beyond session averages — available separately or combined in the Trader Pack. Every release is tested on live markets before launch, with free updates included. Support covers guided setup, video tutorials, and direct contact via Telegram or WhatsApp — no ticket queue. The tools work with any ATAS instrument with tick data, including CME and Eurex futures and major crypto exchanges.
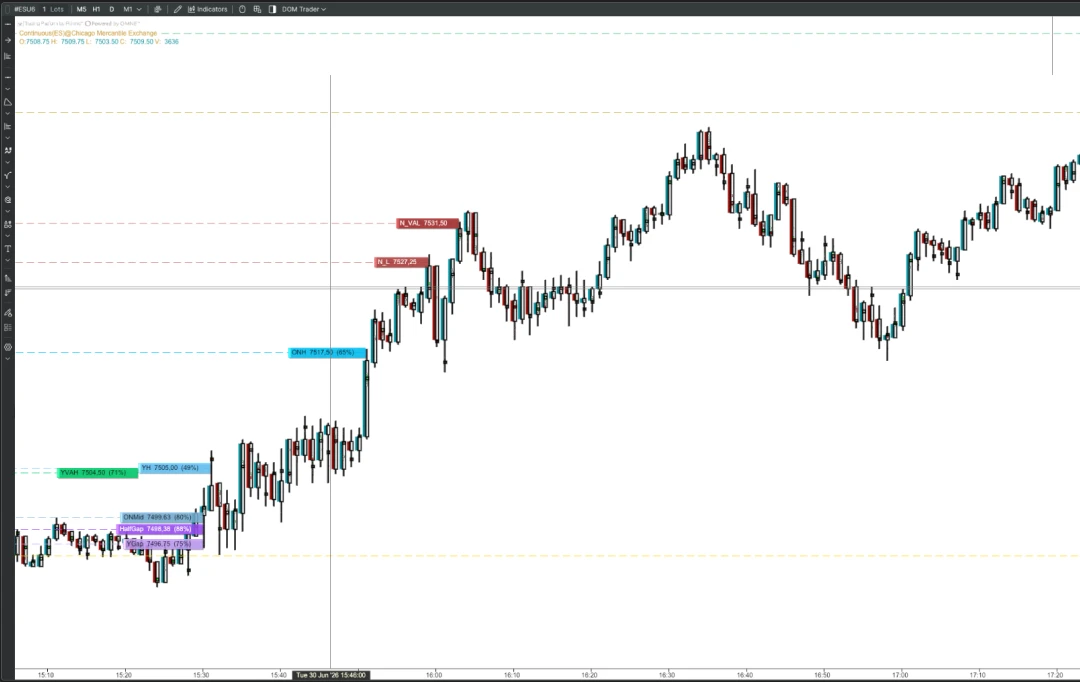
An indicator automatically plots key reference levels traders watch — prior-day high/low/close, overnight high/low, and volume/delta-profile levels (POC/VAH/VAL). Tracks naked levels, logs every touch, and builds per-level stats with a Bias Panel.