
 Publication:16.09.2026
Market Structure
- Category: Algotrading
- Asset class: Futures, Stocks, Forex/CFD, Cryptocurrencies
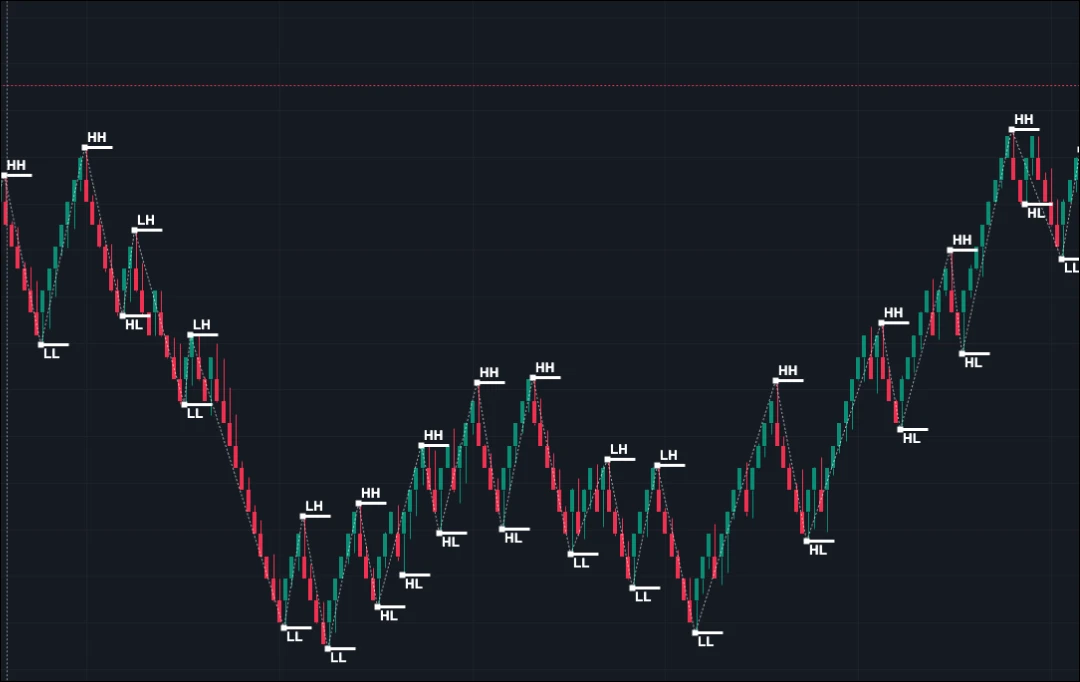
Description
Automatically labels HH (Higher High), HL (Higher Low), LH (Lower High), and LL (Lower Low) swing points — providing an instant overview of market structure.
Key Features
-
Automated Swing Point Labeling. Identifies and marks Higher Highs, Higher Lows, Lower Highs, and Lower Lows directly on the chart.
-
Trend Shift Recognition. Helps highlight structural changes and potential market trend reversals.
-
Universal Timeframe Support. Operates seamlessly across all available timeframes in ATAS X.
-
Clean Visual Presentation. Displays clear text markers and labels without cluttering your chart interface.
Settings
Visual styling, font customization, lookback sensitivity parameters.
Independent developer specializing in ATAS indicators. The author (Adam Pixa) has been actively trading for over 6 years and has spent a long time creating custom indicators for ATAS — with more than 60 proprietary indicators to his name, originally built for personal use and for friends. He previously worked as a software developer, which gave him experience writing clean, maintainable code.
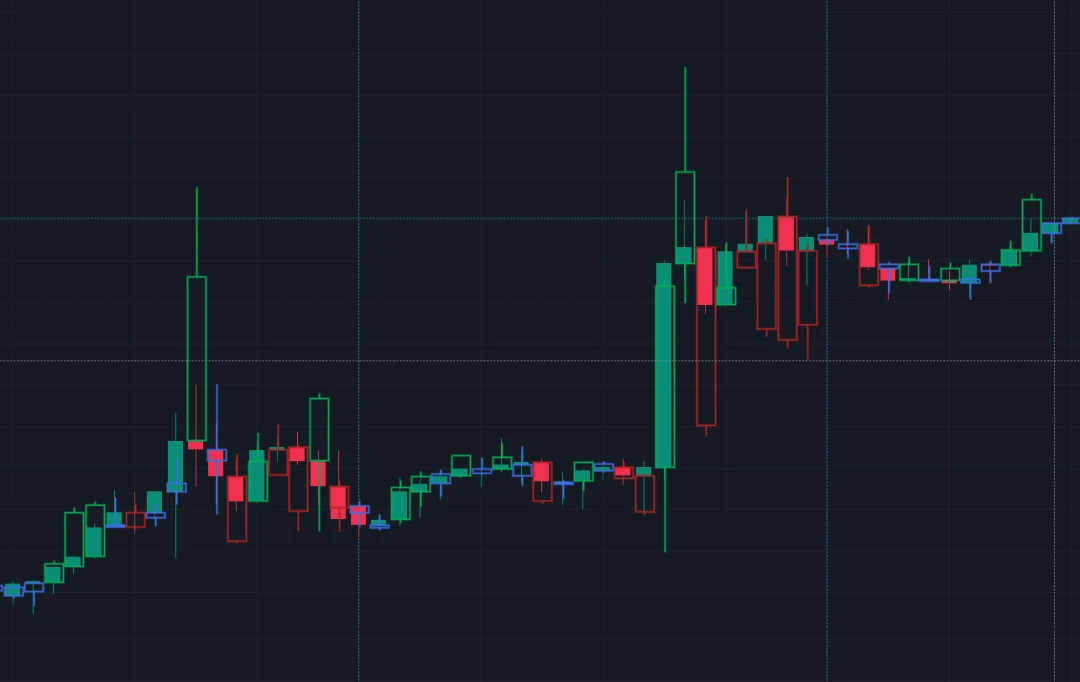
An order flow visualization indicator: it reshapes each candle based on its delta instead of the actual price range, helping you spot absorption — when aggressive orders are absorbed by passive liquidity without price moving.
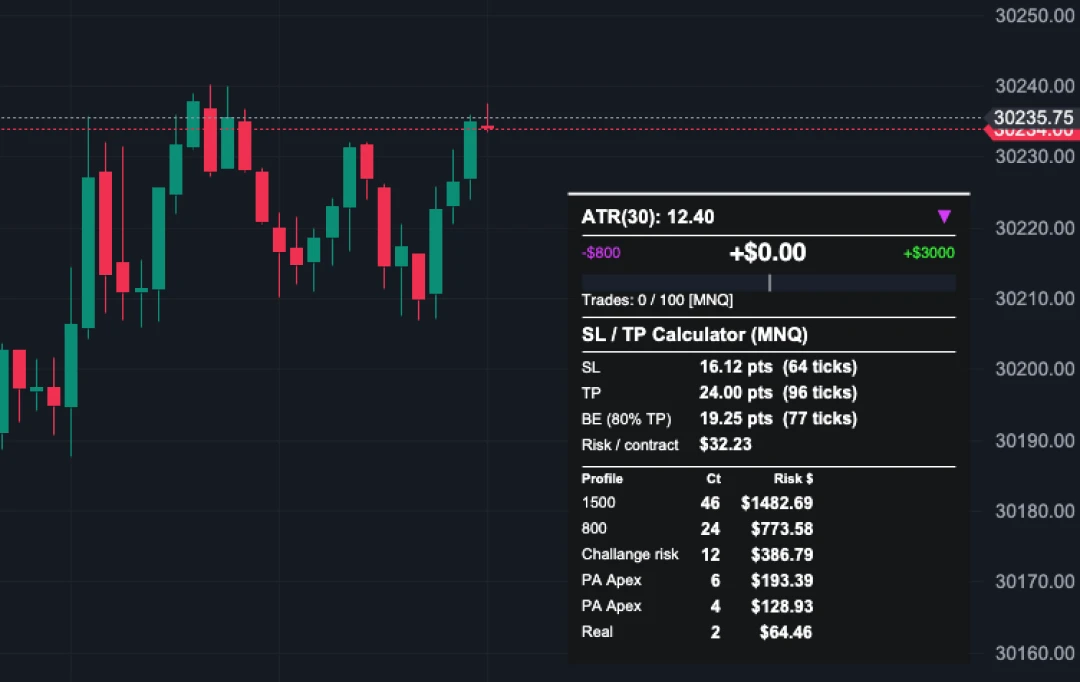
An ATR-based position sizing and risk management indicator: automatic position sizing, ATR-based risk calculation, current and historical ATR modes, and a custom risk amount.
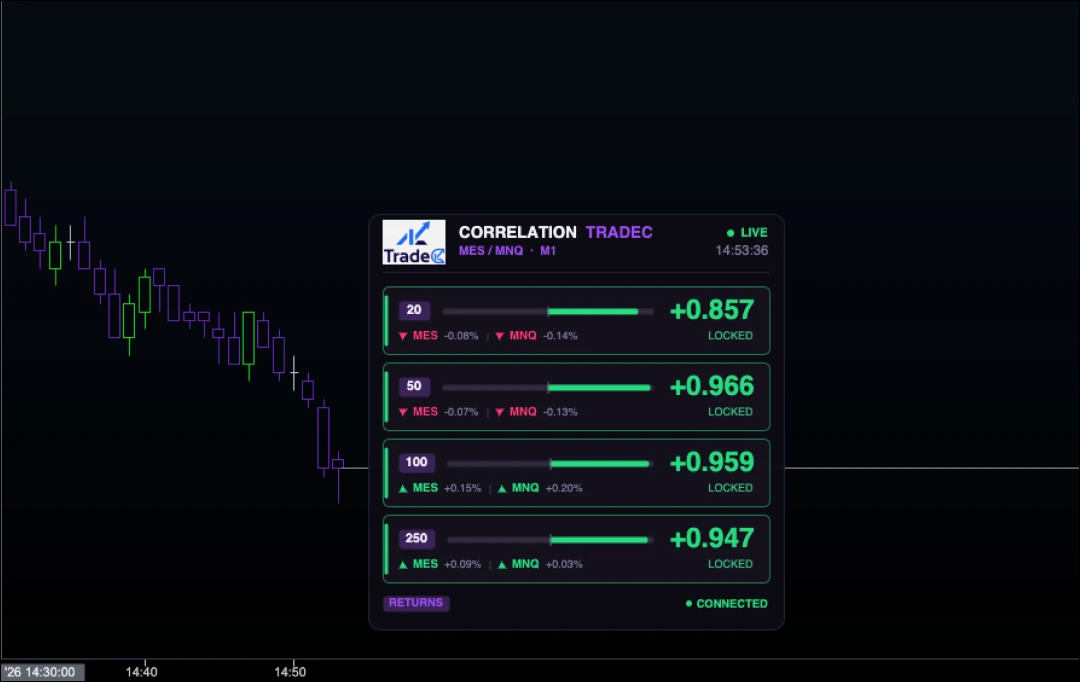
Tracks real-time correlation between NQ/ES or MNQ/MES directly on a single chart. Eliminates the need to monitor multiple windows, helping you spot divergence and cross-market shifts instantly.
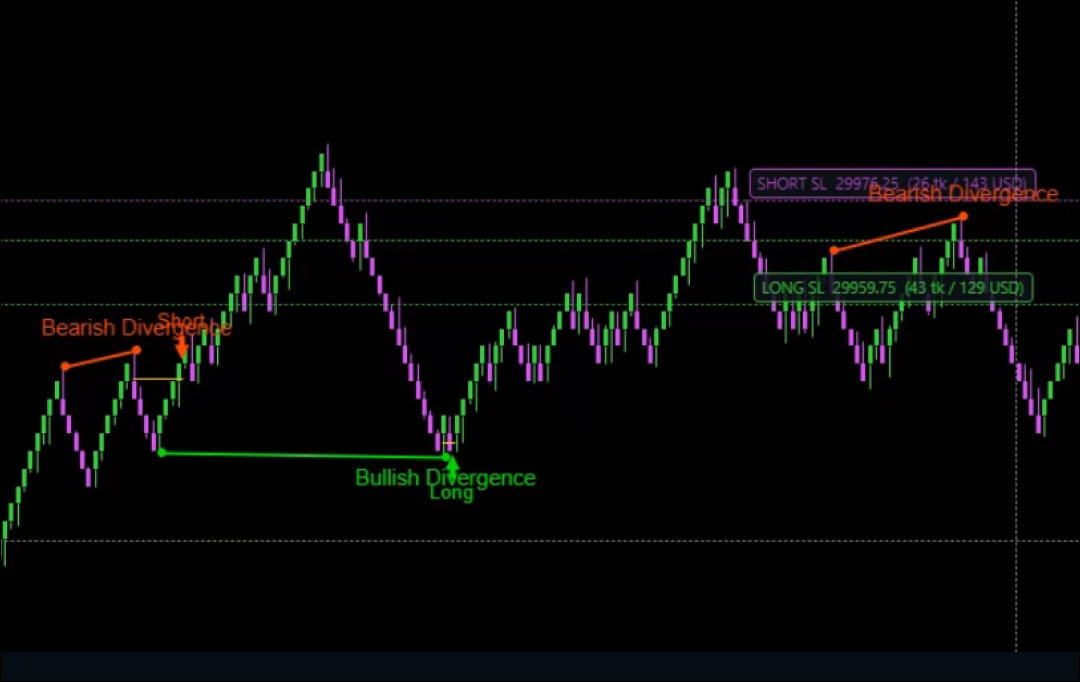
An order flow indicator: it finds bullish and bearish divergences between price and CVD in real time, right as the candle forms, and highlights them on the chart. Extra context beyond price, based on volume and delta.
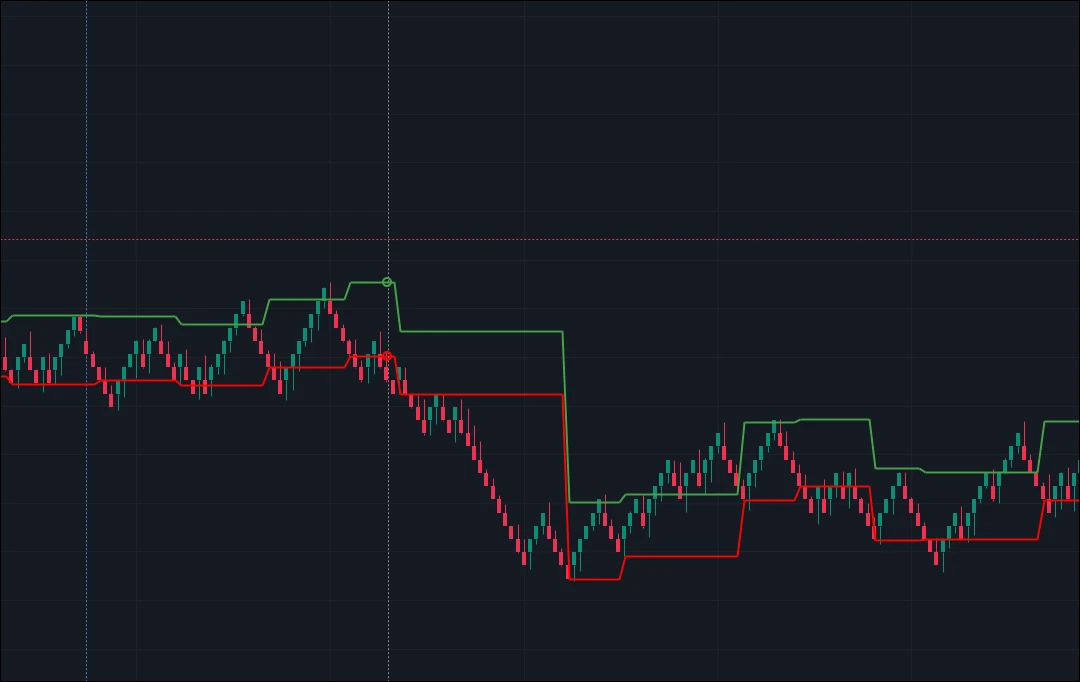
Darvas Box indicator for ATAS X: automatically plots dynamic Darvas Boxes to identify trends and breakouts. Highlights upper/lower breakout boundaries and trend direction with custom color coding across any instrument or timeframe.
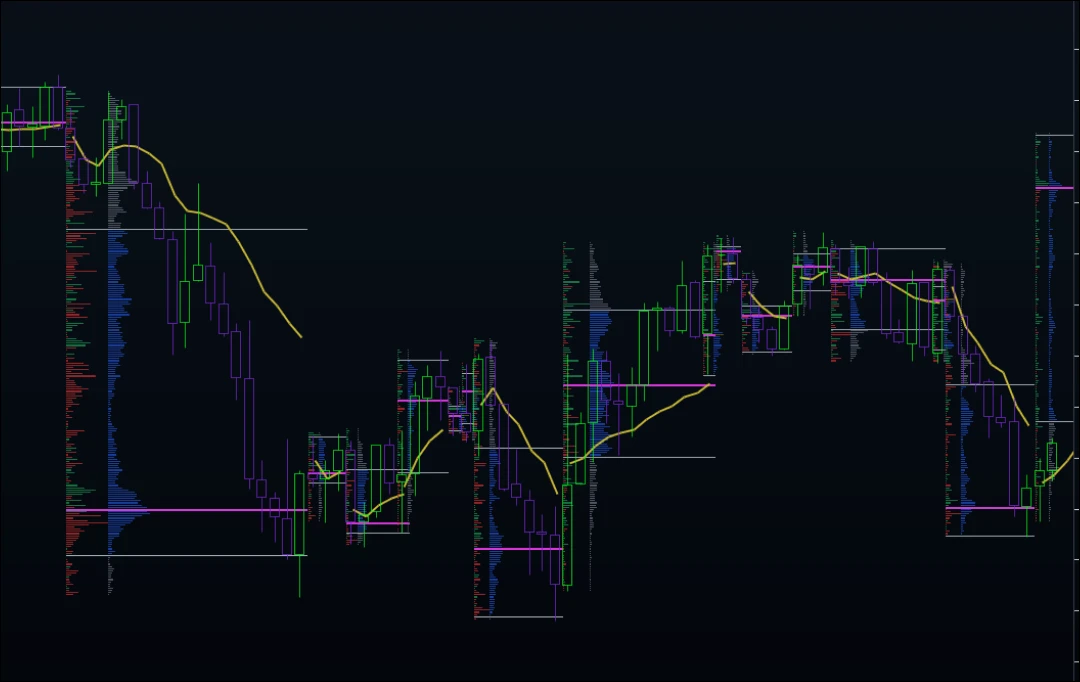
Breaks key market swings into volume profiles and plots individual swing VWAPs. Identifies HVNs, LVNs, and break-of-structure context across movements. Includes 80 customizable settings in 11 sections.
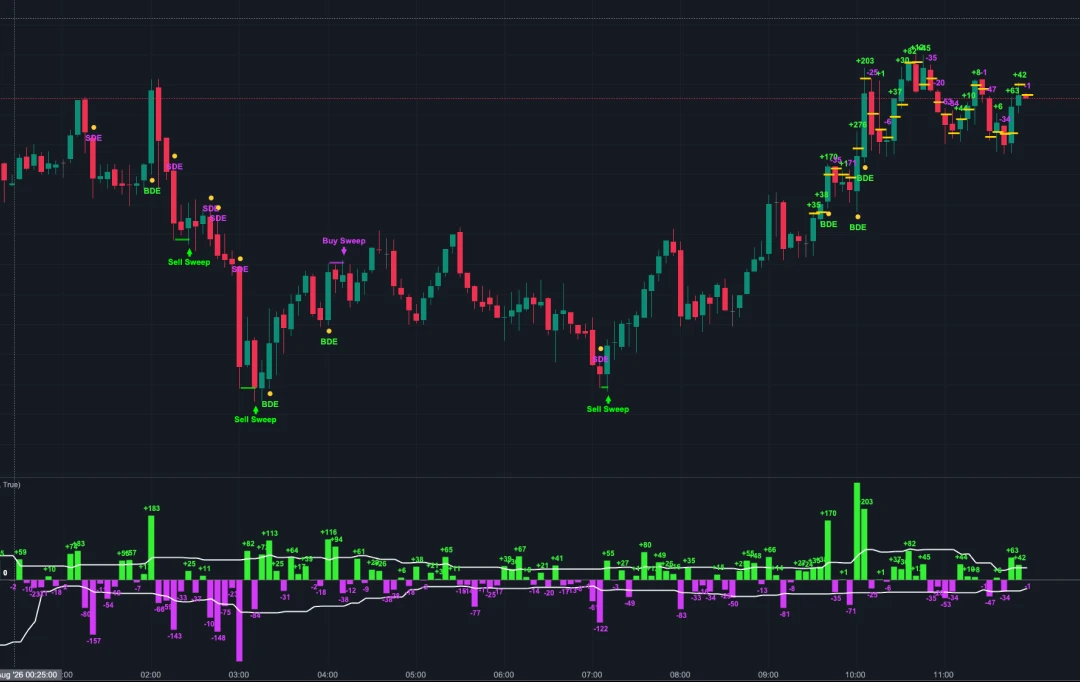
An order flow indicator built on candle delta: candle delta, average buy/sell delta, delta extremes, and absorption. Helps you tell normal activity apart from abnormally aggressive buying or selling.
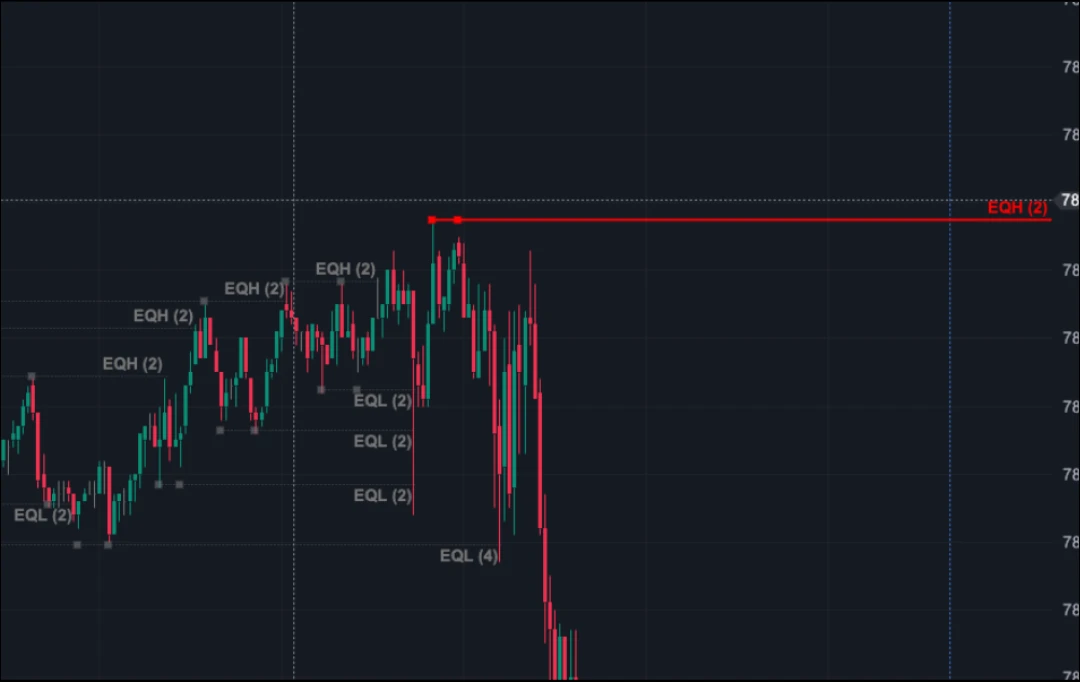
Market structure indicator for ATAS X: automatically identifies and highlights equal highs and lows on the chart — potential liquidity concentration zones and key reference points for sweeps, breakouts, and reversals.
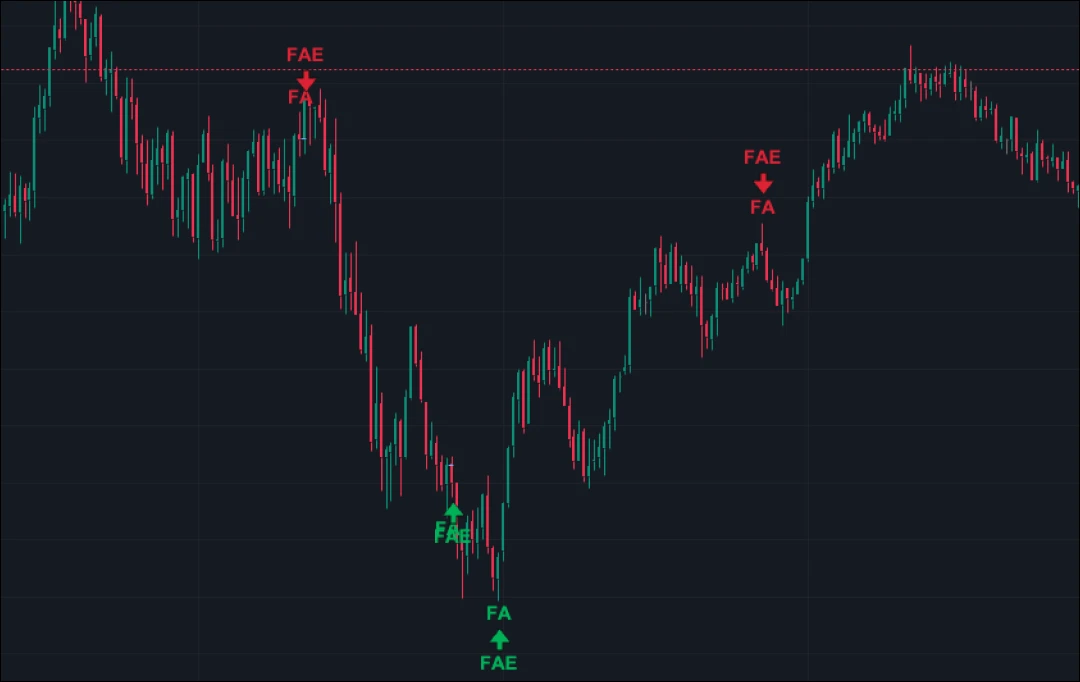
Failed Auction indicator for ATAS X: detects failed auctions (FA/FAE) where market movement stalls at extremes. Plots clear markers on highs and lows to highlight exhaustion zones and key reference points for potential reversal trades.
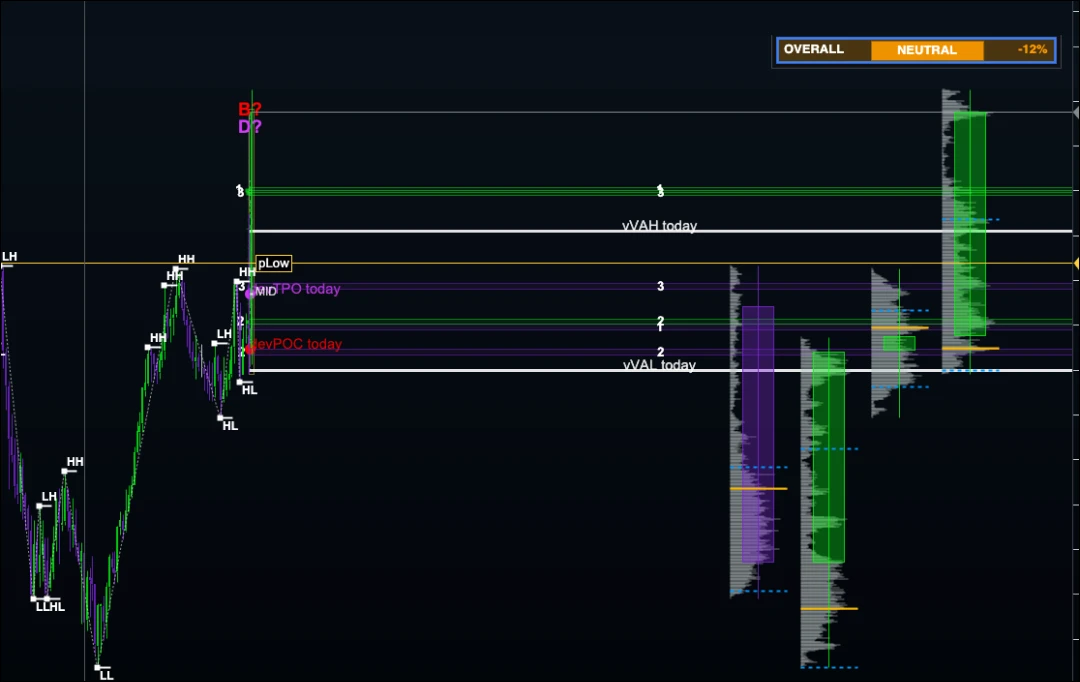
Higher timeframe indicator: displays higher timeframe candles along with their Volume Profile directly on your chart. View broader market context and key volume levels without constantly switching between timeframes in ATAS X.