
 Publication:16.09.2026
TradeGEX
- Category: Algotrading
- Asset class: Futures, Options
Description
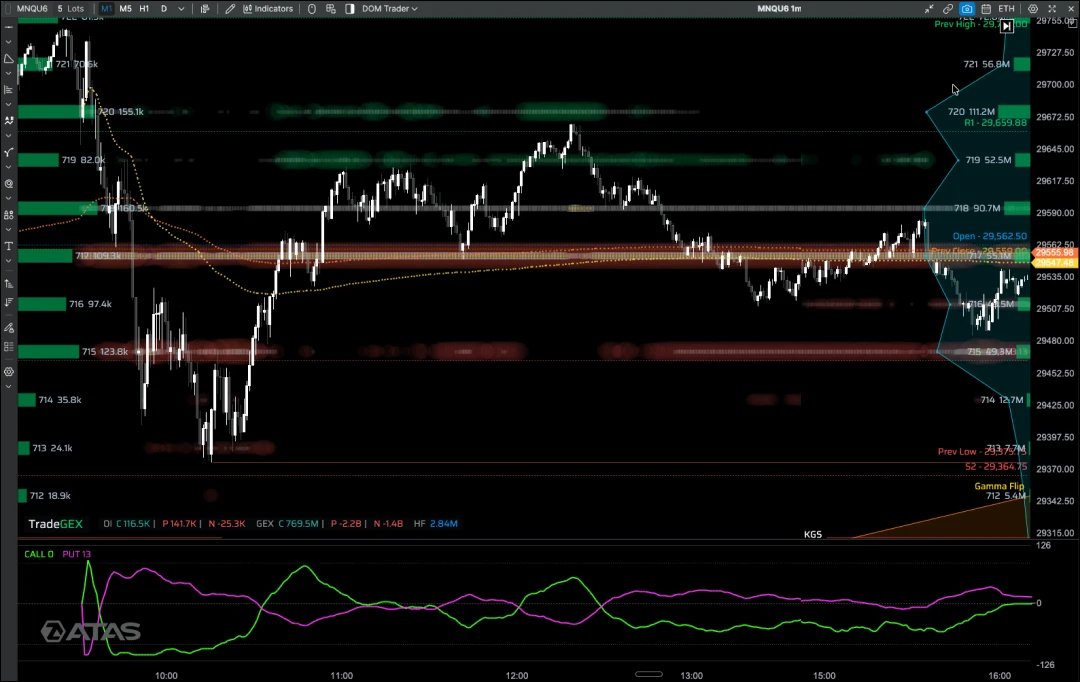
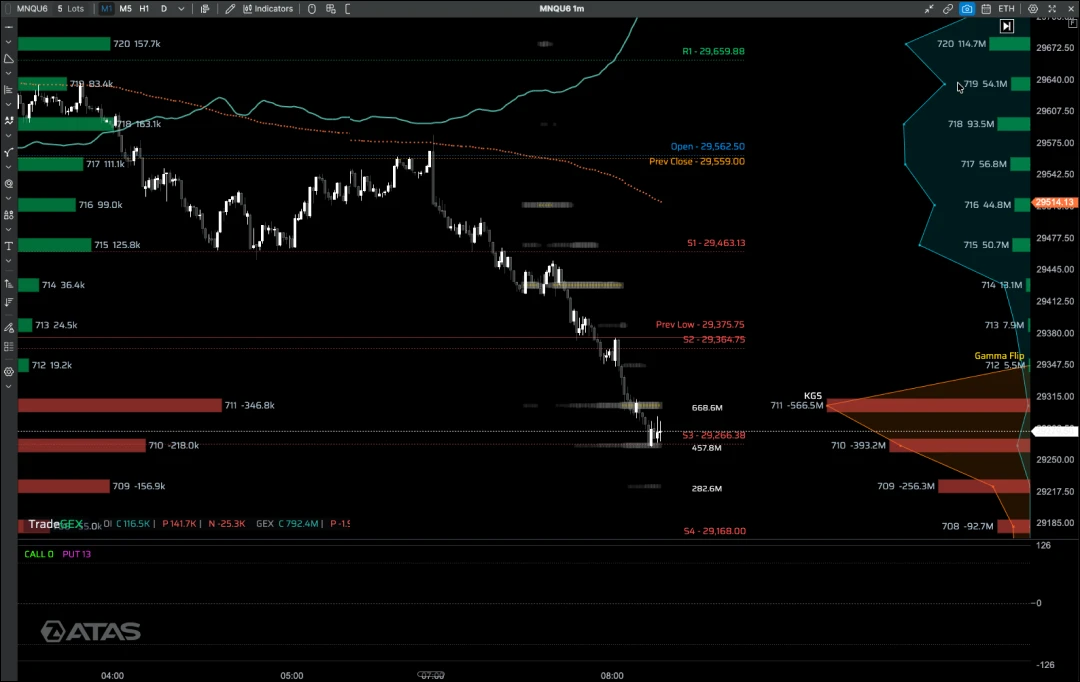
A market-structure indicator built on options data. Rather than being built from price alone, it shows a real-time estimate of gamma and delta exposure, dealer hedging flow, and key levels — calculated from the options markets linked to each future.
An estimate of dealer options positioning is plotted directly on the futures chart: gamma exposure (GEX) and delta exposure (DEX) bars, plus levels where dealer hedging activity may concentrate (call wall, put wall, gamma flip, KGS).
These are examples of context for a trader's own analysis. TradeGEX is a data visualization and market analysis tool, not a source of trading advice or signals.
Hedge Flow is a proprietary indicator that estimates the direction and intensity of dealer hedging in real time (teal for bullish pressure, red for bearish).
Multi-market flow oscillator puts ES, NQ, VIX, and options flow (call, put, and net) on a single normalized scale — to see cross-market pressure and divergences.
Built from deep index and ETF options market data (SPY, SPX, QQQ, IWM, GLD, USO), projected onto the futures you trade: ES, NQ, YM, RTY, GC, CL.
Works live, intraday, rendered natively on the ATAS chart — not an end-of-day report.
How It Works
TradeGEX reads options order flow and open interest on the index and ETF markets linked to each future (for example, SPY and SPX for ES, QQQ for NQ, IWM for RTY, GLD for GC, USO for CL). From this data, it calculates dealer gamma exposure (GEX) and delta exposure (DEX), identifies the strikes where hedging activity concentrates (call wall, put wall, gamma flip), and converts them into price levels on the matching futures chart. Hedge Flow estimates the direction and intensity of dealer hedging in real time, and the multi-market oscillator normalizes ES, NQ, VIX, and options flow onto a single zero-centered scale to show confluence and divergence. Everything renders natively on the ATAS chart — alongside the order flow and volume you already work with.
Settings
Each layer can be toggled independently (GEX/DEX bars, Hedge Flow, key levels, oscillator, dominance markers), you choose which levels to display, and colors and style adapt to your ATAS workspace.
Example Use Cases
Price approaches the call wall on ES — the trader uses the level as context for where dealer hedging may slow or reverse momentum.
The gamma flip on NQ may reflect a shift in market behavior (more mean-reverting above the level, more trending below it) — the trader factors this in as part of their own analysis.
If Hedge Flow turns and holds a direction while price tests a level, this may help the trader distinguish a genuine break from a false one.
On the oscillator, price makes a new high while net options flow shifts toward zero — a divergence the trader may read as a move not confirmed by positioning.
Pricing
Subscription:
- $59.99/month
- $299 for 6 months
- $599 for a year (≈$50/month)
Includes a free 3-day trial with no card required — you can try it on your own charts before subscribing. One subscription covers the TradeGEX desktop apps and the native ATAS indicators.
Developer of a SaaS platform for market data analysis. Specializes in analyzing Gamma Exposure (GEX), options flow, and cross-market correlation across futures (NQ, ES, YM, RTY, GC, CL) and major stocks (NVDA, TSLA, AAPL, MSFT, AMZN, META, GOOGL). The product is available as a web app, native macOS and Windows applications, and native ATAS indicators. TradeGEX also offers educational resources — Academy and Playbook — for traders interested in options and their impact on futures and stocks.