
 Publication:21.05.2026
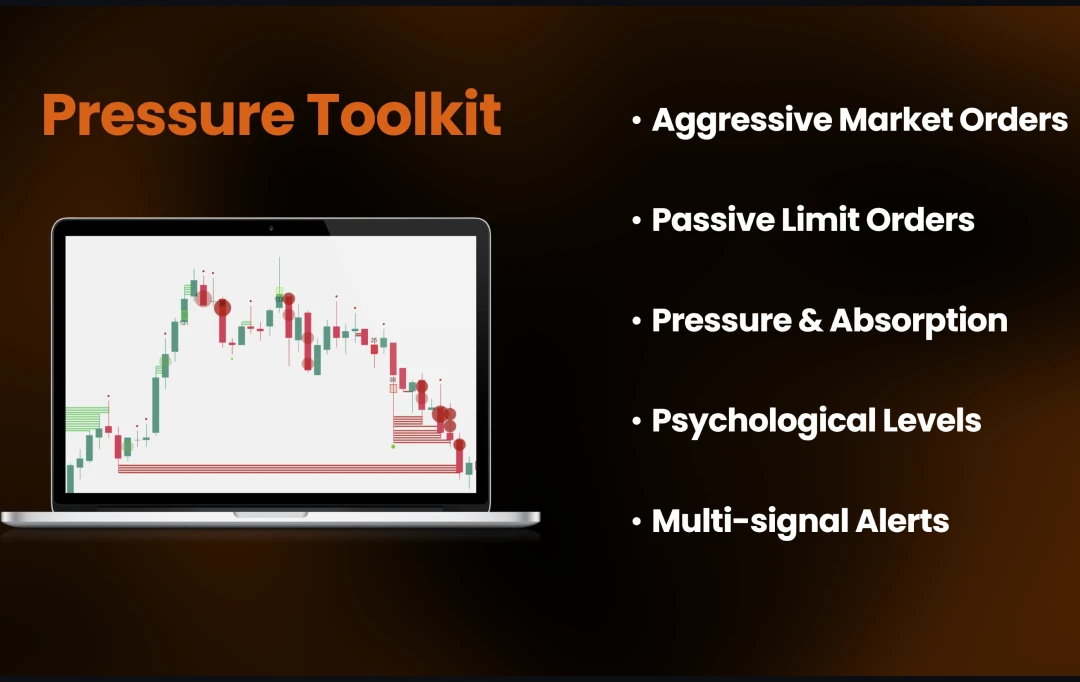
Pressure Toolkit
- Catégorie: Trading algorithmique
- Classe d’actifs: Futures, Actions, Forex/CFD, Cryptomonnaies
Description
Pressure Toolkit est un indicateur personnalisé d'order flow basé sur le volume qui lit les données footprint/cluster pour détecter la pression acheteuse et vendeuse au niveau des prix.
Fonctionnalités principales
Pressure Bubbles — détecte la pression acheteuse/vendeuse, en distinguant les marques faibles (sombres) et fortes (lumineuses).
Big Trade Detection — met en évidence quand un trade exceptionnellement important coïncide avec une bulle de pression, affichant le prix exact et le volume.
Absorption Dots & Lines — identifie quand un volume élevé est absorbé dans les mèches, avec des points renforcés pour les événements d'absorption statistiquement significatifs.
Psychological Levels — niveaux ronds adaptatifs qui s'ajustent automatiquement au prix de n'importe quel instrument.
Full Alert System — alertes en direct séparées pour les bulles, les gros trades, les points d'absorption, les lignes d'absorption et les franchissements de niveaux psychologiques.
Comment ça marche
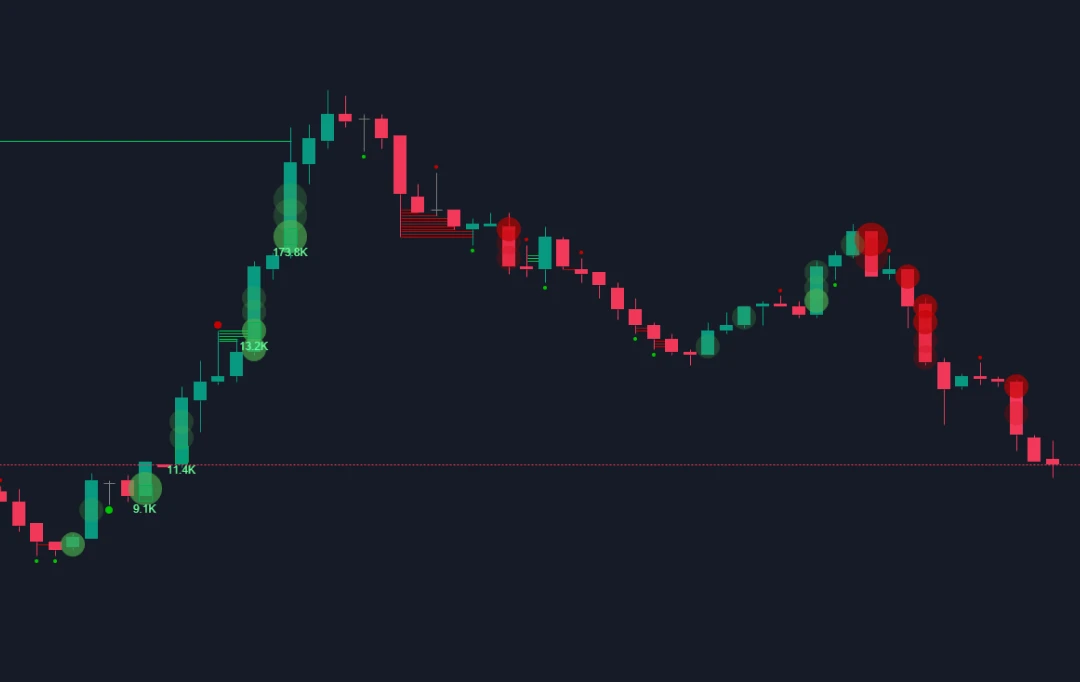
Pressure Toolkit analyse le volume bid et ask à chaque niveau de prix au sein de chaque bougie pour détecter où l'order flow agressif et l'absorption se produisent.
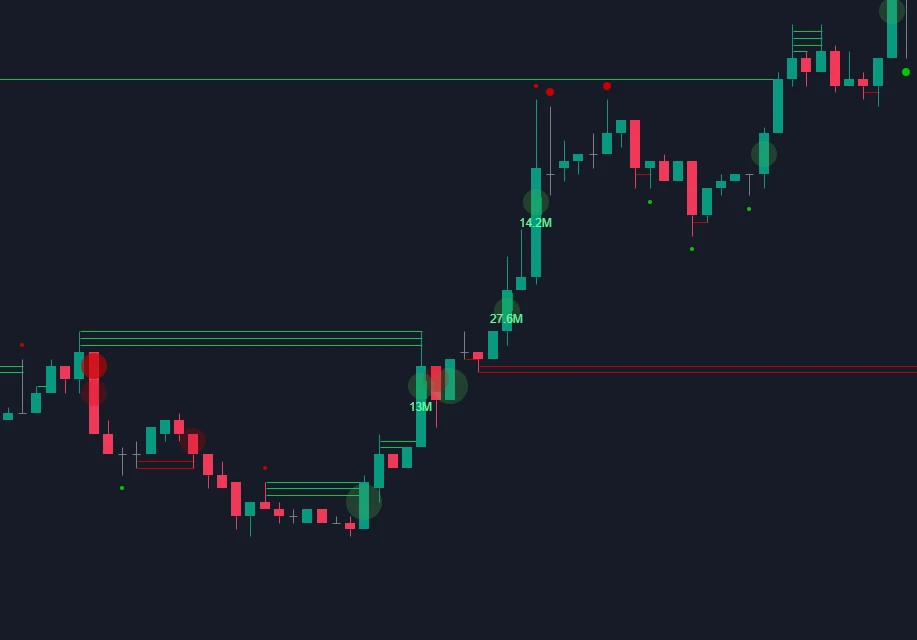
Les Pressure Bubbles identifient les bougies où une forte pression acheteuse ou vendeuse est concentrée, les marqueurs plus lumineux indiquant une plus grande conviction. Quand un trade exceptionnel coïncide avec une bulle, il est mis en évidence avec le prix et le volume exacts affichés.
Les dots and lines d'absorption détectent le volume significatif absorbé dans les mèches des bougies, les lignes marquant les niveaux de prix spécifiques où cela se produit et s'étendant vers l'avant jusqu'à ce que le prix revienne les tester.
Les niveaux psychologiques calculent automatiquement les prix ronds pertinents pour tout instrument et génèrent des alertes lorsque le prix les franchit en temps réel.
Personnalisation & Alertes
Pressure Toolkit fonctionne sur toutes les unités de temps. Tu peux ajuster la sensibilité de chaque fonction de l'indicateur, et activer des alertes pour toutes les fonctionnalités disponibles.
Cas d'utilisation
- Un trader remarque le prix qui revient vers un niveau psychologique clé.
- Lorsqu'il touche le niveau, des points d'absorption apparaissent montrant un volume élevé absorbé dans la mèche — les vendeurs sont agressifs, mais le prix ne baisse pas.
- À la bougie suivante, une bulle de pression lumineuse se déclenche, confirmant qu'une forte pression acheteuse est intervenue.
- Sur la base de ces données, le trader décide d'ouvrir une position longue, en utilisant le niveau psychologique inférieur comme point d'invalidation.
Pour les utilisateurs d'ATAS
15% de réduction avec le code promo: PRO15
Une entreprise qui développe des logiciels éducatifs, fournissant des indicateurs graphiques et d'autres outils analytiques. Améliorez l'efficacité de vos stratégies avec les outils avancés de ProfitPro.
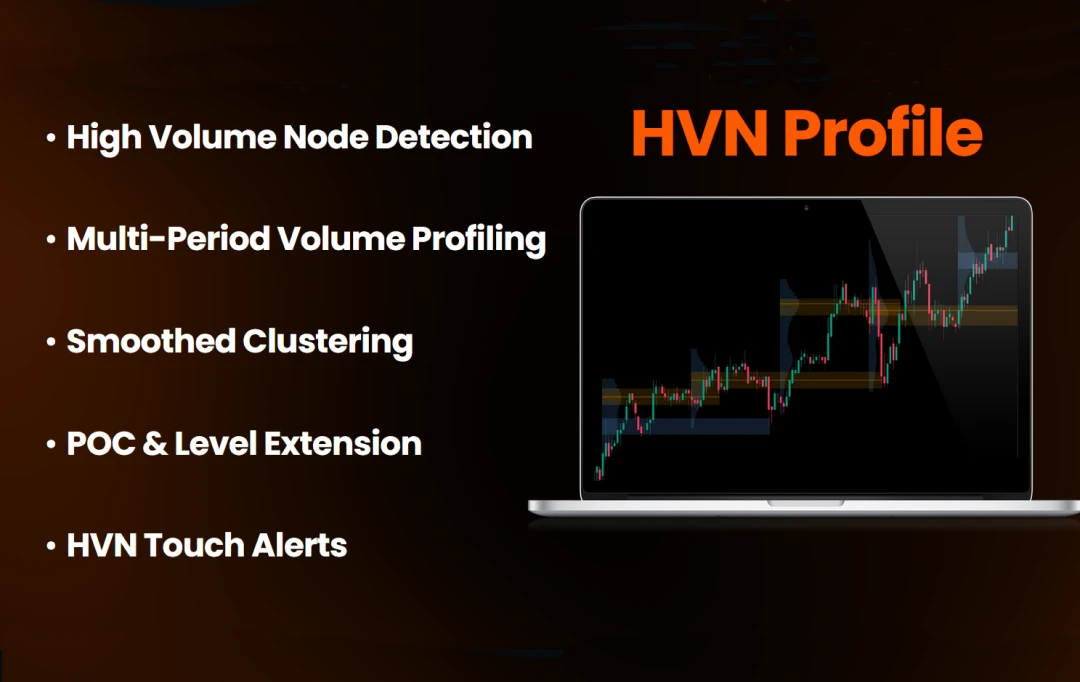
HVN Profile est un outil de cartographie des nœuds à fort volume qui identifie les clusters de volume clés servant de support/résistance, avec alertes lorsque le prix réagit à ces niveaux.
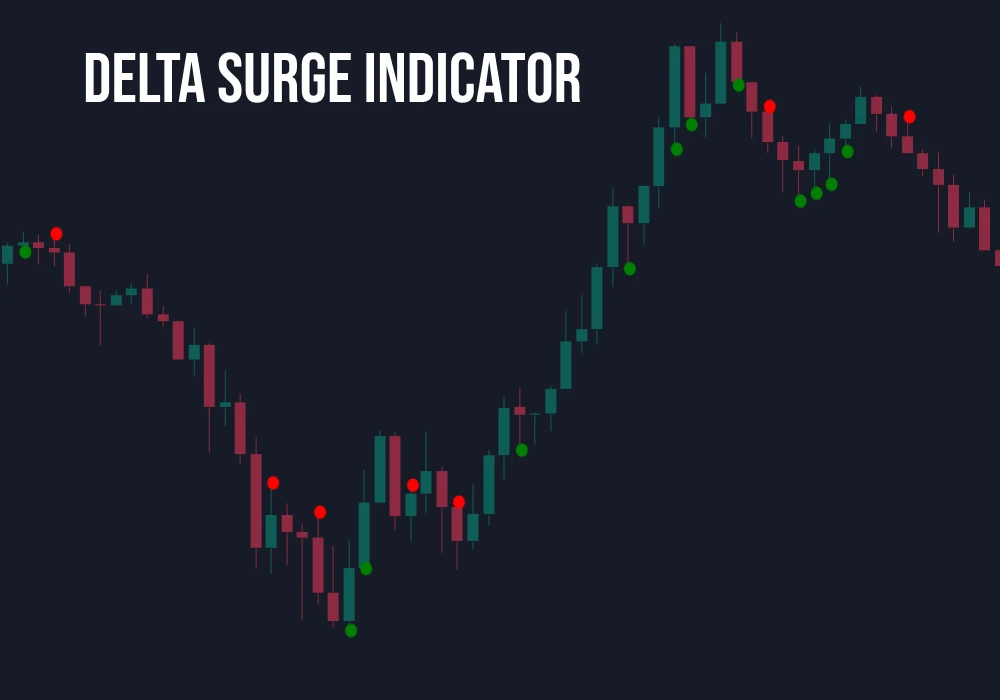
L'indicateur Delta Surge met en évidence les moments où le delta à l'intérieur des bougies affiche une hausse ou une baisse significative sur un nombre défini de barres consécutives.
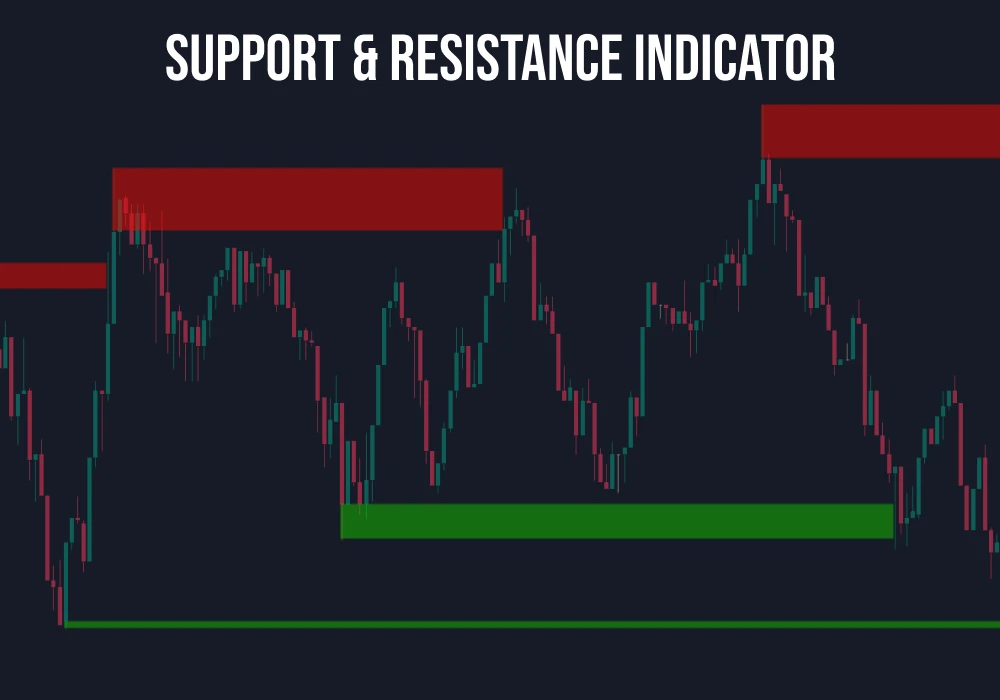
Indicateur précis de support et résistance qui identifie en temps réel les niveaux swing "naked" — un outil précieux pour les stratégies de cassure et de retournement.
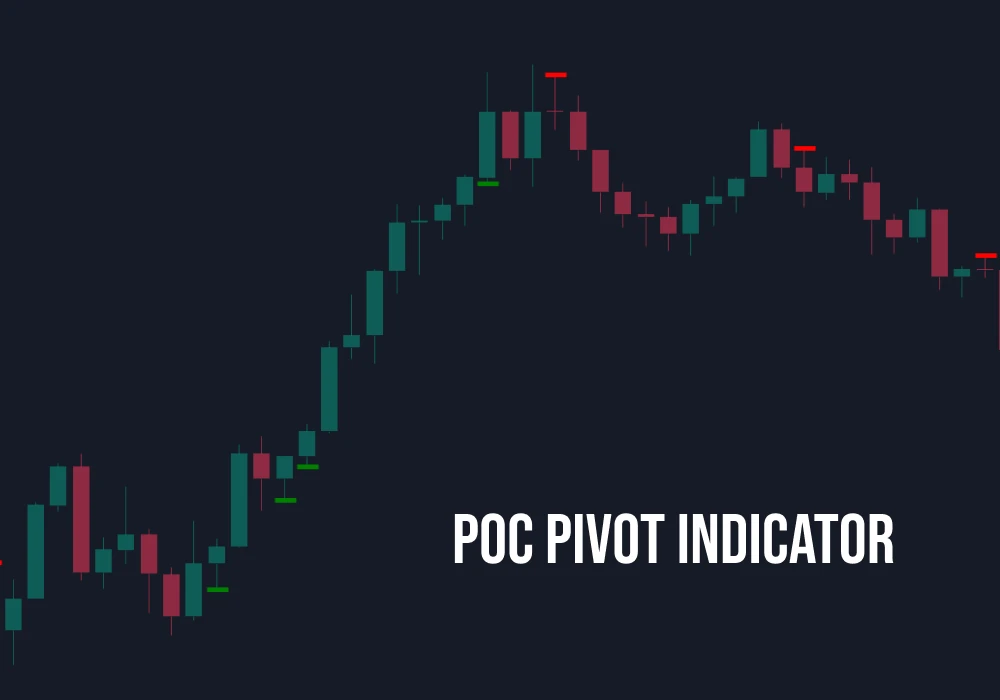
L'indicateur POC Pivot identifie les points de contrôle saillants, mettant en évidence les zones où le volume est fortement directionnel.
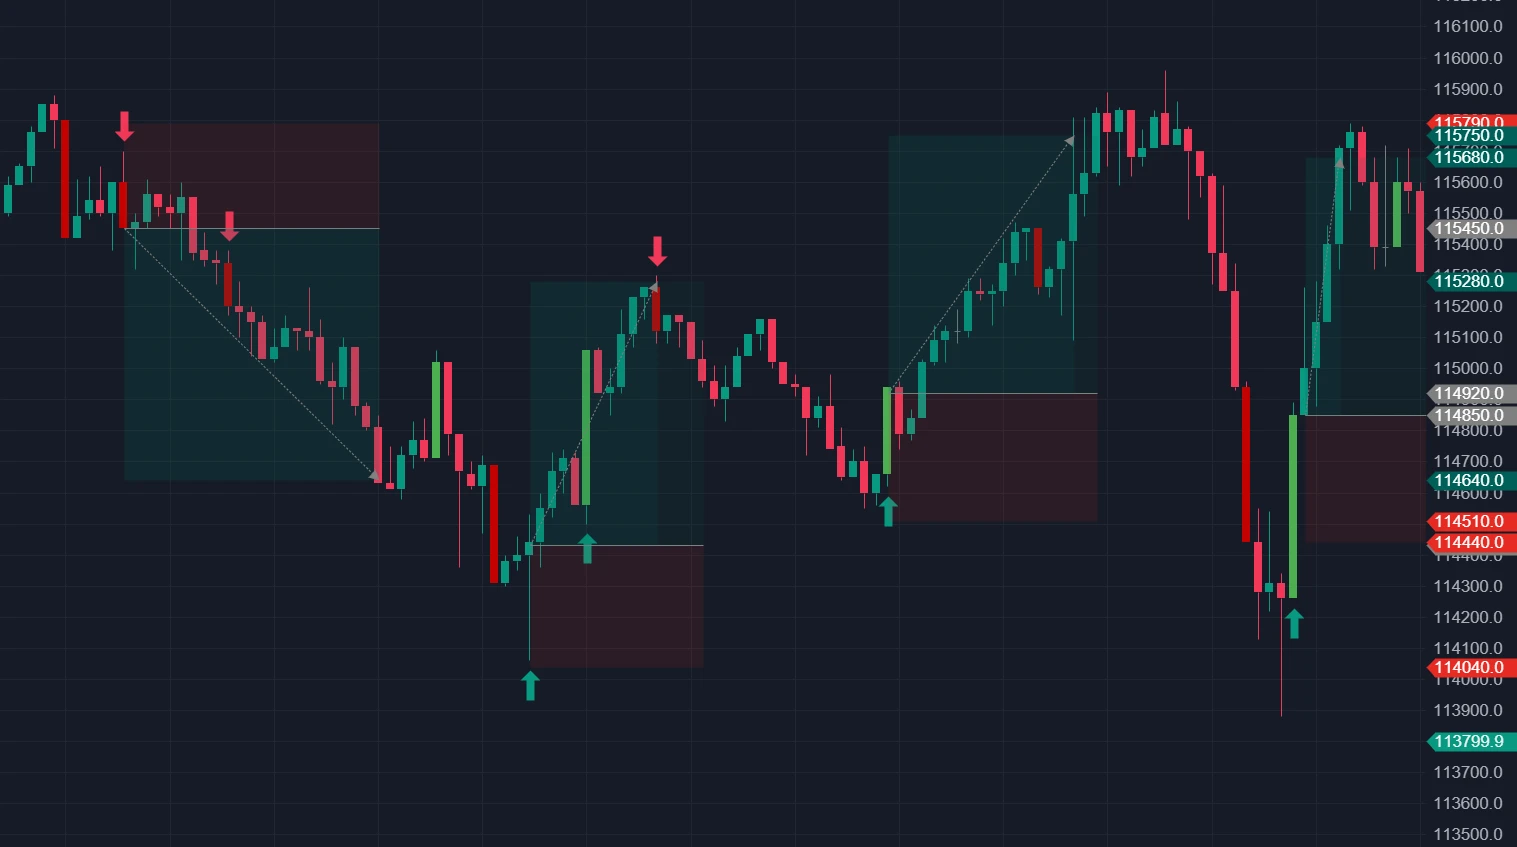
L'indicateur Pulse affiche des flèches haussières et baissières issues des données bid/ask. Il propose quatre types d'indication activables, des alertes personnalisables et des réglages de sensibilité pour des signaux sur mesure.
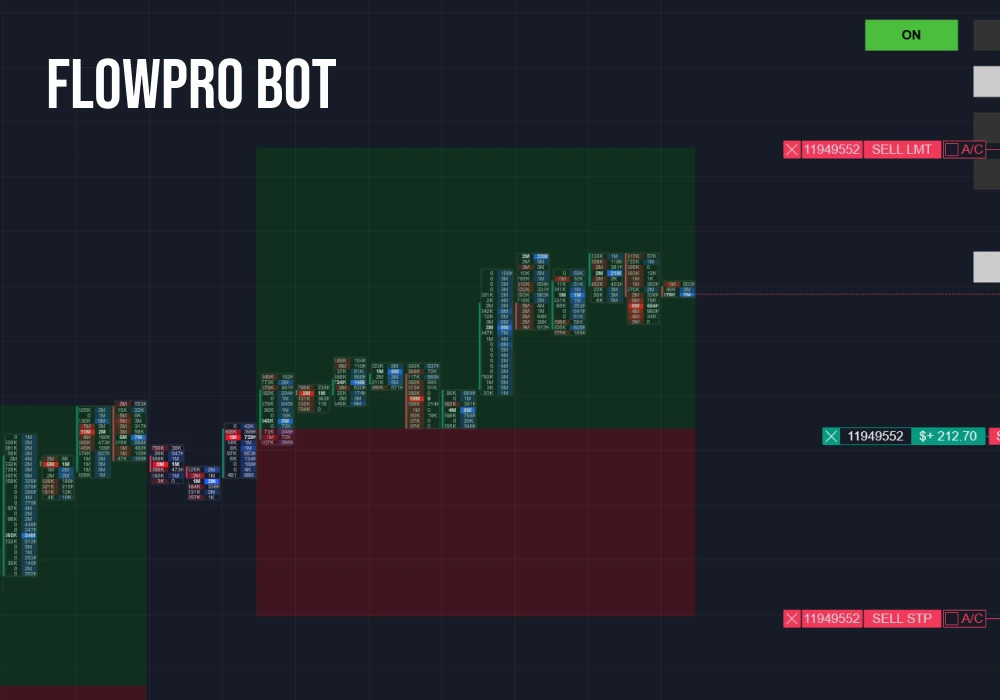
Outil automatisé d'exécution d'ordres pour marchés crypto et futures, basé sur l'analyse de pression de marché. Exécute des trades quand la pression correspond à tes conditions, avec stop-loss et take-profit automatiques.