
 Publication:17.09.2026
Bullish/Bearish POC
- Category: Algotrading
- Asset class: Futures, Stocks, Cryptocurrencies
Description
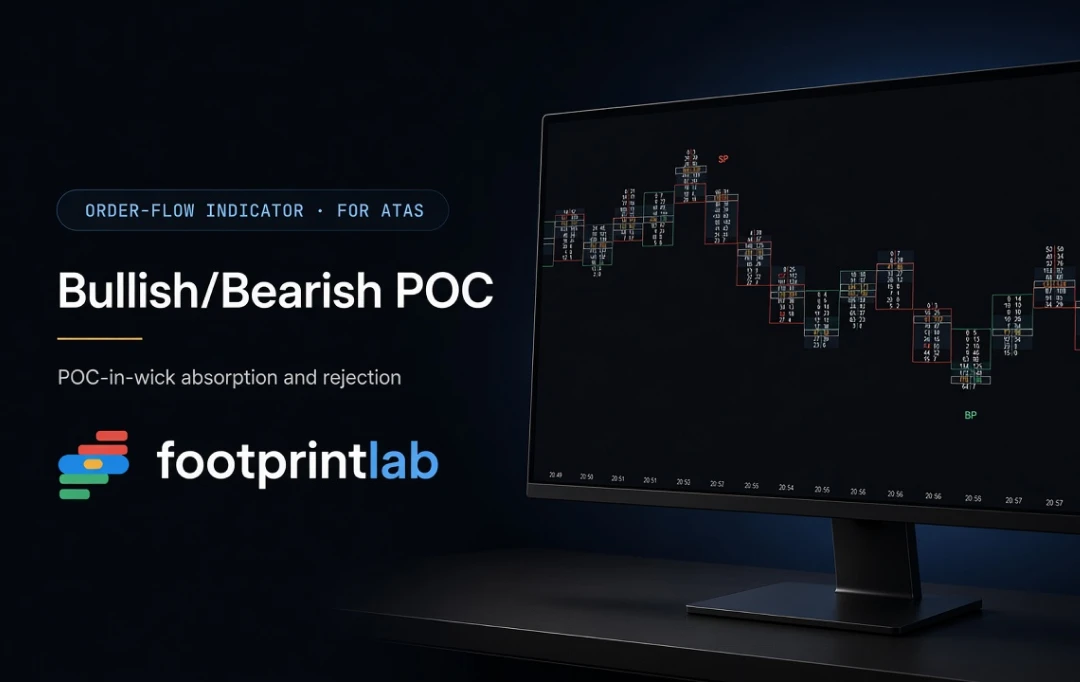
The indicator automates the detection of absorption and volume concentration patterns by analyzing the placement of a bar’s Point of Control (POC) relative to its range and candle body.
Key Features
-
BP/SP Detection: Identifies bullish bars (closing up) with POC near the low (labeled BP) and bearish bars (closing down) with POC near the high (labeled SP).
-
Optional Wick Filter: Restricts signals exclusively to bars where the POC lies outside the candle body, strictly isolating the "POC in the wick" absorption condition.
-
CT Marker (Continuous POC): Highlights consecutive bars sharing the exact same POC (within a half-tick tolerance) with a colored horizontal dash directly on the chart level.
-
Label Merging: Merges overlapping signals into unified labels when multiple conditions match on the same candle (e.g., "CT / BP").
-
Flexible Strictness: Adjustable percentage threshold defining proximity to the bar's High/Low.
-
Closed-Bar Calculation: Evaluates volume distributions per bar and freezes markers upon bar close.
How It Works
-
BP & SP Identification: The indicator extracts the Max Volume Price (POC) from footprint data per candle. A bar receives a BP tag if it closes higher and its POC falls within the bottom percentage threshold measured from the low. It receives an SP tag if it closes lower and its POC rests within the upper percentage threshold from the high.
-
Wick Filter Logic: When the Wick Filter is toggled on, the POC must also sit outside the candle body by at least half a tick (below the body for bullish bars, above for bearish bars), ensuring true wick-level volume absorption.
-
Continuous POC Tracking: The indicator tracks POC levels across adjacent candles. If consecutive bars share a POC within half a tick, a CT marker is triggered to highlight sustained volume concentration at a single price tier.
-
Data Requirements: Requires price-level volume data (footprint/clusters). Unsupported on spot Forex.
Settings
-
Lookback Period (bars): Historical calculation depth for performance optimization.
-
POC Position Max % from High/Low: Max allowable percentage distance from the extreme (lower values enforce stricter conditions).
-
Enable Wick Filter: Toggle ON/OFF to restrict signals strictly to candle wicks.
-
Show CT (Continuous POC): Toggle ON/OFF for consecutive POC identification.
-
Bullish / Bearish Label Text: Customizable text tags (defaults to BP and SP).
-
Font Size & Offset (ticks): Fine-tune visual spacing above or below bars.
-
Bullish, Bearish & Continuous-POC Colors: Custom palette assignment.
Use Cases
-
Absorption at Support (ES): On a 2,000-volume ES footprint chart, price tests an intraday support zone. A bullish candle prints its POC inside its lower wick below the candle body, triggering a green BP tag beneath the bar. This indicates heavy volume executed at the low—a signal that buyers absorbed aggressive market sells.
-
Sustained Resistance (NQ): On NQ, three consecutive bearish bars stack their POCs at the same price tier near their high wicks. The indicator prints SP labels above the candles alongside horizontal CT dashes at the shared price level, signaling seller re-entry and volume stacking at resistance.
-
Confluence Strategy: Best applied as a supplementary filter alongside order flow metrics like market delta, volume imbalances, VWAP, and structural session levels.
Footprint-Lab is a developer of professional analytical tools and trading panels for ATAS. The company specializes in products for deep Order Flow analysis, volume profiling, and automated risk management. Their product lineup includes the JSI Pattern Research pattern backtesting system, the Pattern Runner live monitoring module, and the SFE TradingBoard interactive risk calculator. All Footprint-Lab solutions are built with zero "black box" code and fully integrate with ATAS charts and historical data.
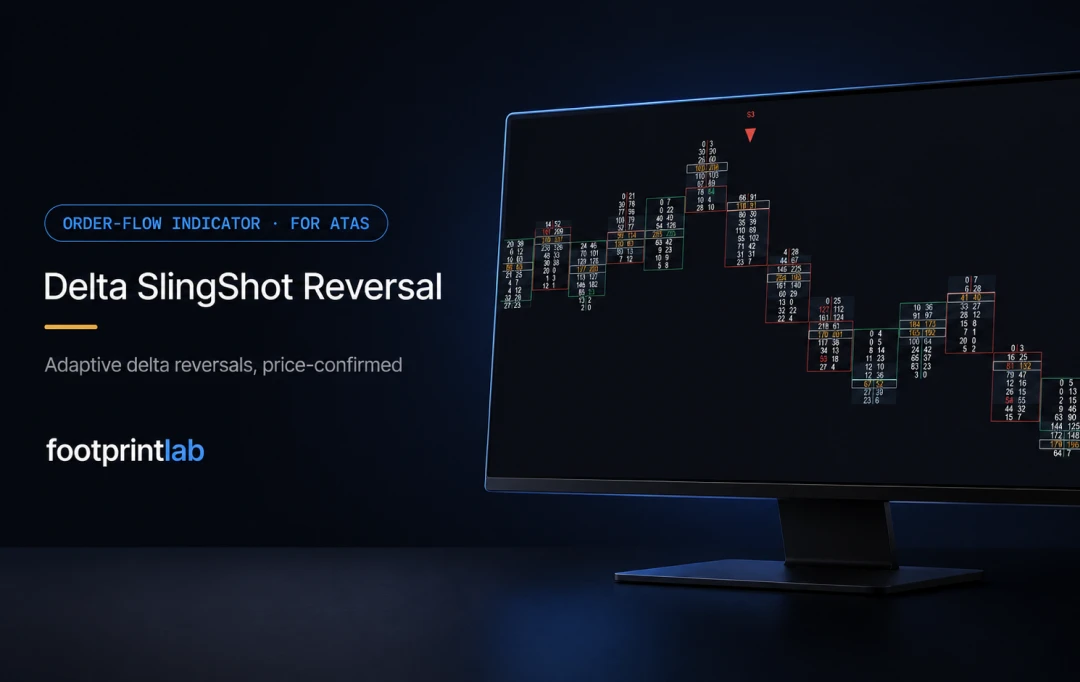
Adaptive delta reversal indicator marking sudden shifts in buyer/seller aggression via a self-calibrating band with price confirmation. Dynamic thresholds adjust automatically to session volatility instead of fixed values.
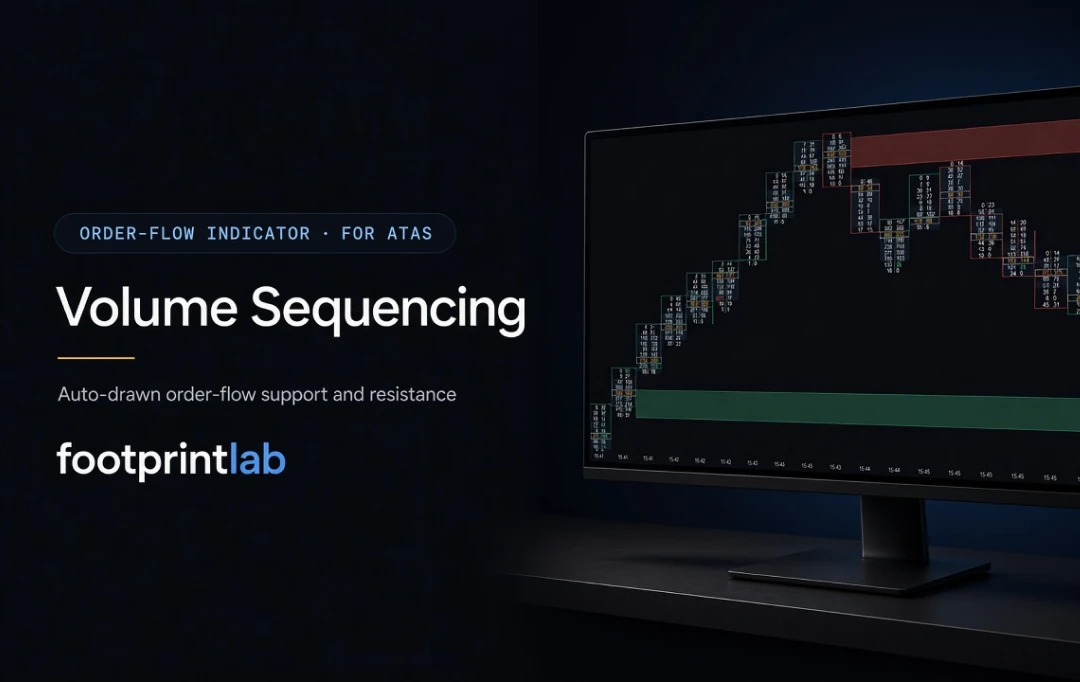
Automatically builds support/resistance zones where aggressive buyers or sellers stacked strictly increasing volume up the price ladder to an extreme. Turns manual footprint reading into clear, actionable zones that hold until tested.