
 Publication:17.09.2026
Delta SlingShot Reversal
- Category: Algotrading
- Asset class: Futures, Stocks, Cryptocurrencies
Description
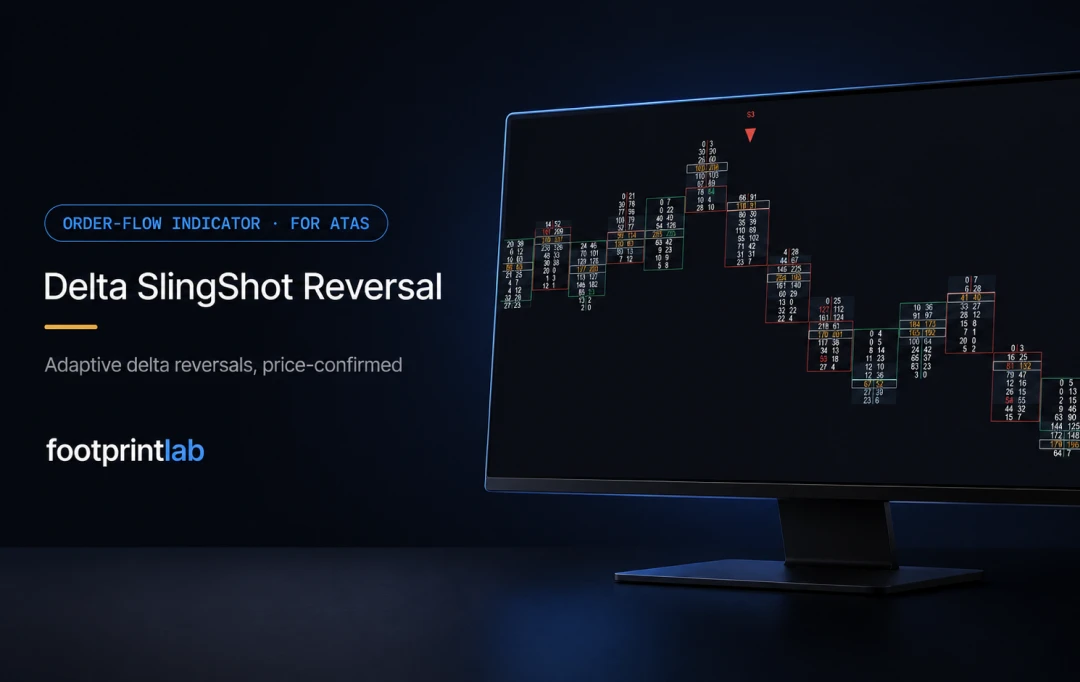
The indicator automates the identification of sudden order flow reversals by tracking extreme shifts in market delta relative to a self-calibrating volatility band, requiring mandatory price action confirmation.
Key Features
-
Adaptive Delta Band: Continuously measures bar delta against a moving mean and standard deviation over a customizable lookback window, establishing dynamic volatility thresholds.
-
Mandatory Price Confirmation: Prevents false signals by requiring the reversal candle to close in the direction of the turn AND surpass reference price levels—filtering out delta spikes ignored by price.
-
Dual Rigor Setups (2-Bar & 3-Bar): Features a sensitive 2-bar reversal setup (B2/S2) alongside a stricter 3-bar sequence (B3/S3). 3-bar markers render larger and offset further for instant visual clarity.
-
Customizable Chart Markers: Displays event-based markers directly on price candles (arrows, diamonds, squares, or circles) with fully independent colors, sizes, and text labels.
-
On-Chart Overlay: Designed specifically for footprint and candlestick charts to serve as a direct confluence signal.
-
Performance Optimization: Includes a Days-to-Calculate window to maintain fast chart responsiveness over deep historical data.
How It Works
-
Dynamic Band Calculation: For every candle, the indicator computes the bar delta (ask volume minus bid volume), its moving average, and standard deviation over the designated lookback period. Upper and lower bands are generated at $Mean \pm (Multiplier \times StdDev)$.
-
2-Bar Reversal Logic: Triggers when an initial bar prints extreme delta against the move (e.g., delta below the lower band with a bearish close), followed immediately by a reversal bar displaying positive delta above the upper band, a bullish close, and a close higher than the previous bar's open.
-
3-Bar Reversal Logic: Applies stricter criteria across a 3-candle sequence: an extreme delta bar, a pull-back bar with opposing delta, and a confirmation reversal bar that pushes delta beyond the band while closing past the middle bar's close.
-
Data Requirements: Requires order flow data (real bid/ask volume per tick/cluster). Unsupported on spot Forex.
Settings
-
Delta StdDev Length (bars): Lookback window for moving average and standard deviation (shorter values increase sensitivity, longer values smooth detection).
-
Standard Deviation Multiplier: Adjusts band distance (higher values tighten signal frequency).
-
Enable 2-Bar / 3-Bar Setup: Toggles for independent setup activation.
-
Display Mode: Choose between Shape Only, Text Only, or Both.
-
Marker Shapes: Select Arrow, Diamond, Square, or Circle.
-
Offsets & Sizes: Fine-tune spacing in ticks (3-bar setup defaults to 2px larger and 2 ticks further to prevent overlap).
-
Custom Colors & Labels: Assign independent text tags (defaults: B2, S2, B3, S3) and color palettes.
-
Days to Calculate: Historical processing limit (0 = all historical bars).
Use Cases
-
Absorption & Reversal (ES): On a 2,000-volume ES footprint chart, a bar pushes delta sharply below the lower band with a red close. The next bar flips to strong positive delta above the upper band, closing green above the prior bar's open. A B2 marker prints under the swing low, signaling seller absorption and buyer initiative.
-
High-Confluence Flush (NQ): Approaching prior-day support on NQ 1-minute candles, a 3-bar sequence unfolds: an extreme negative delta bar, a small red pullback, and a confirming green candle driving delta above the top band and closing above the pullback bar. A larger B3 marker highlights the confirmed reversal.
-
Strategy Integration: Best utilized at structural session levels, VWAP boundaries, and key liquidity pools alongside broader market analysis.
Footprint-Lab is a developer of professional analytical tools and trading panels for ATAS. The company specializes in products for deep Order Flow analysis, volume profiling, and automated risk management. Their product lineup includes the JSI Pattern Research pattern backtesting system, the Pattern Runner live monitoring module, and the SFE TradingBoard interactive risk calculator. All Footprint-Lab solutions are built with zero "black box" code and fully integrate with ATAS charts and historical data.
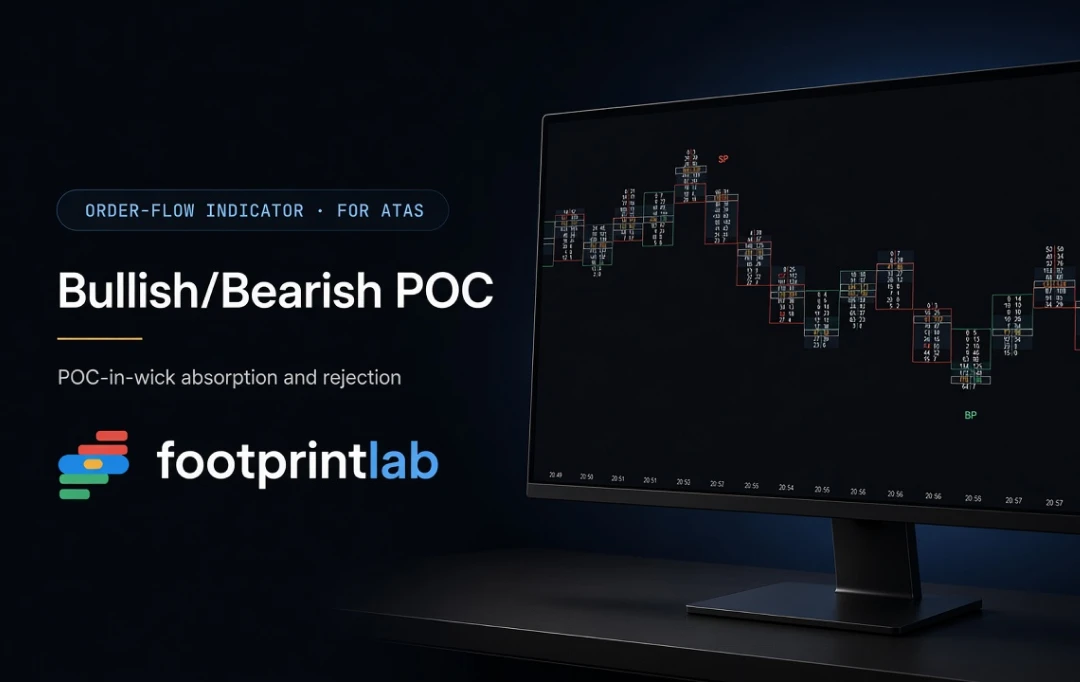
Automatically marks bars where Point of Control forms in the candle wick — signaling potential absorption and rejection. Displays BP/SP markers when met, plus Continuous-POC for high-volume accumulation levels.
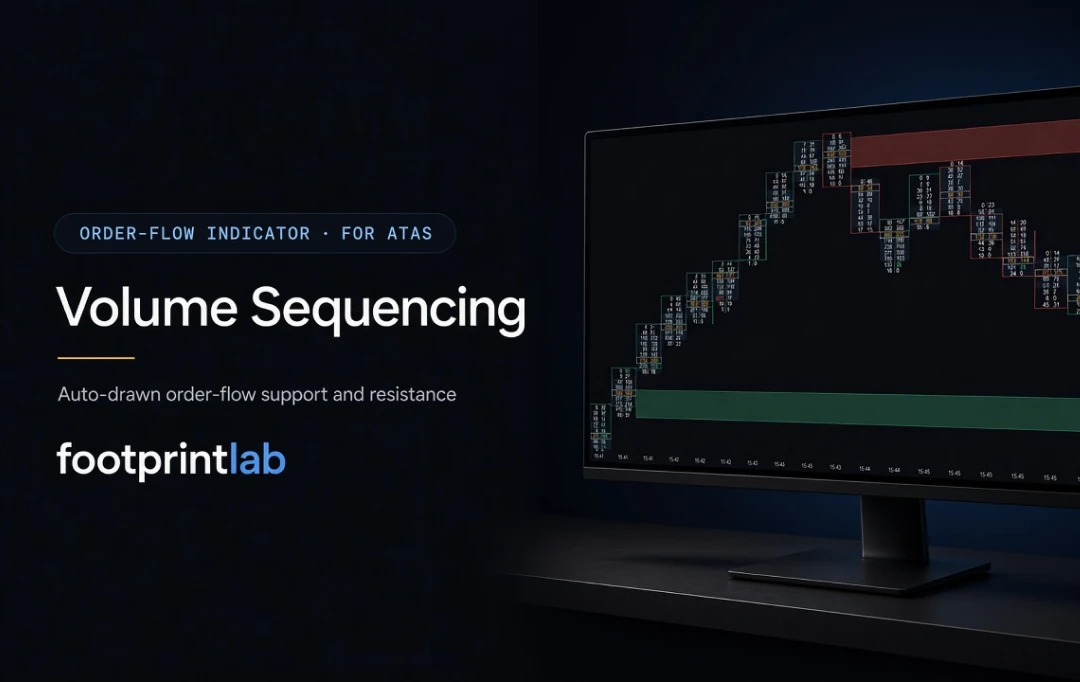
Automatically builds support/resistance zones where aggressive buyers or sellers stacked strictly increasing volume up the price ladder to an extreme. Turns manual footprint reading into clear, actionable zones that hold until tested.