
 Publication:17.09.2026
JSI Pattern Research™
- Category: Algotrading
- Asset class: Futures, Stocks, Cryptocurrencies
Description
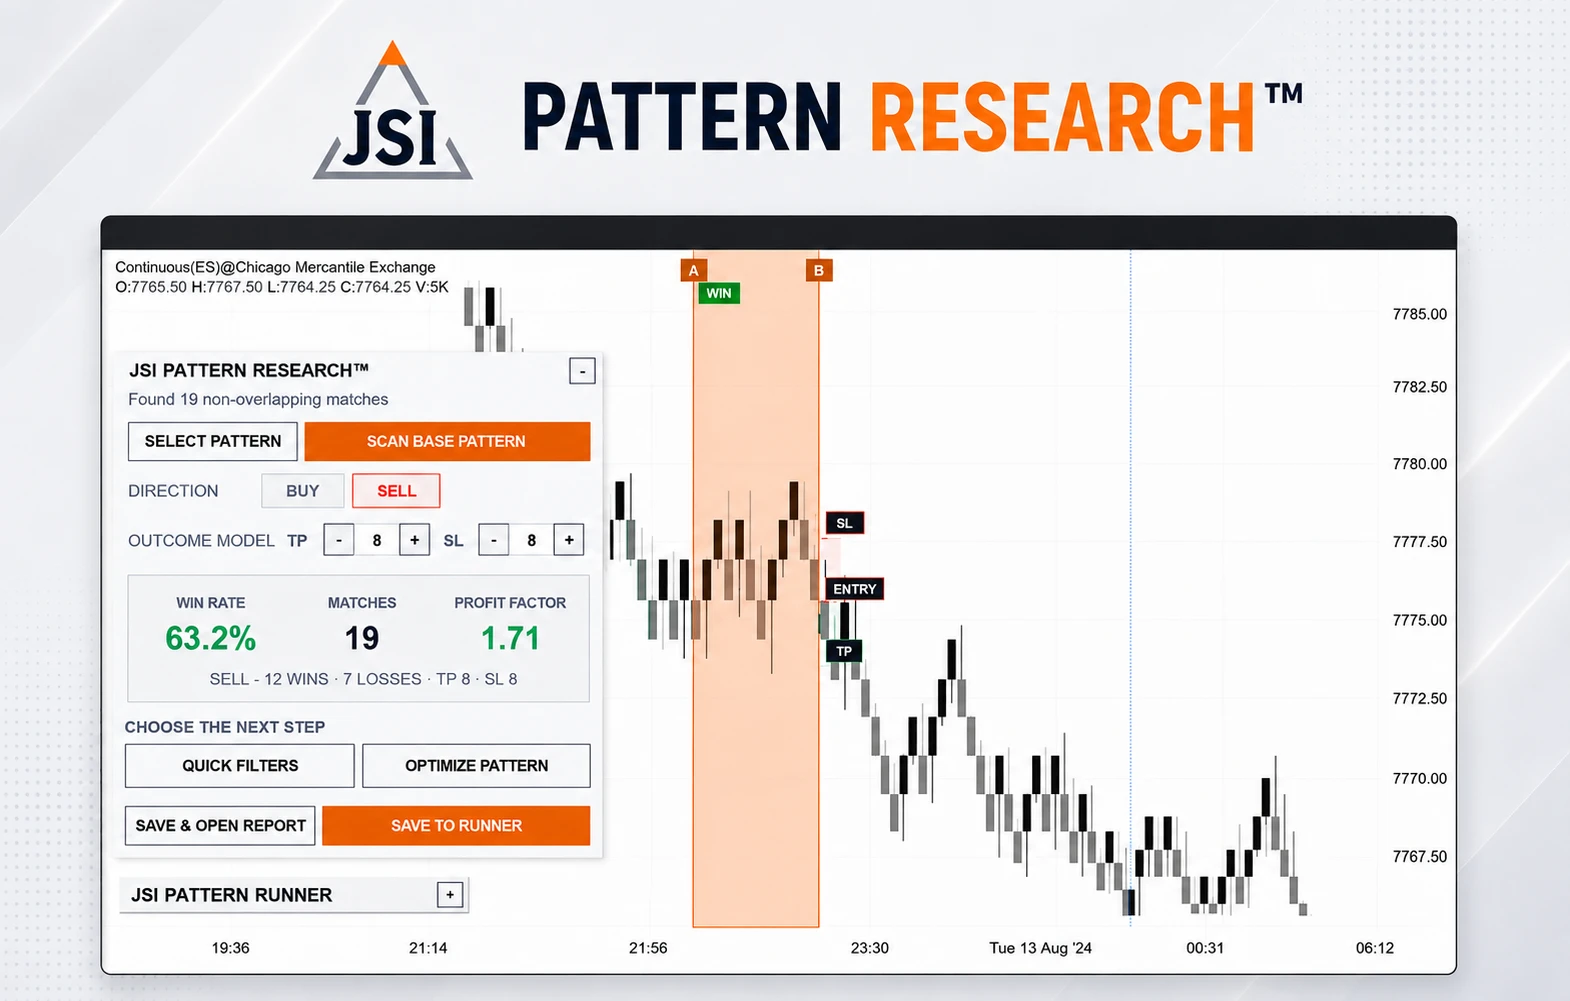
Pattern research and monitoring system for ATAS, designed to test and refine setups identified directly on your chart. Select a candle sequence, evaluate its historical Win Rate, match count (Matches), and Profit Factor, then refine the logic manually or via the JSI Pattern Optimizer. Once a setup proves worthy of observation, transfer the selected logic to JSI Pattern Runner — turning your research into a live visual indicator complete with chart markings and real-time alerts.
All metrics (Win Rate, Matches, Profit Factor) represent retrospective analysis of historical data loaded into ATAS. Past results do not guarantee future performance. JSI Pattern Research does not provide investment advice or direct trading signals — all decisions regarding the use of discovered logic are made independently as part of your own market analysis.
Key Features
-
Chart Selection: Select candle patterns directly on the ATAS chart.
-
Fast Base Scanning: Rapid scanning based on selected candle direction sequences.
-
Historical Metrics: Instant Matches, Win Rate, and Profit Factor calculations.
-
Manual Logic Refinement: Fine-tune setups manually using Quick Filters.
-
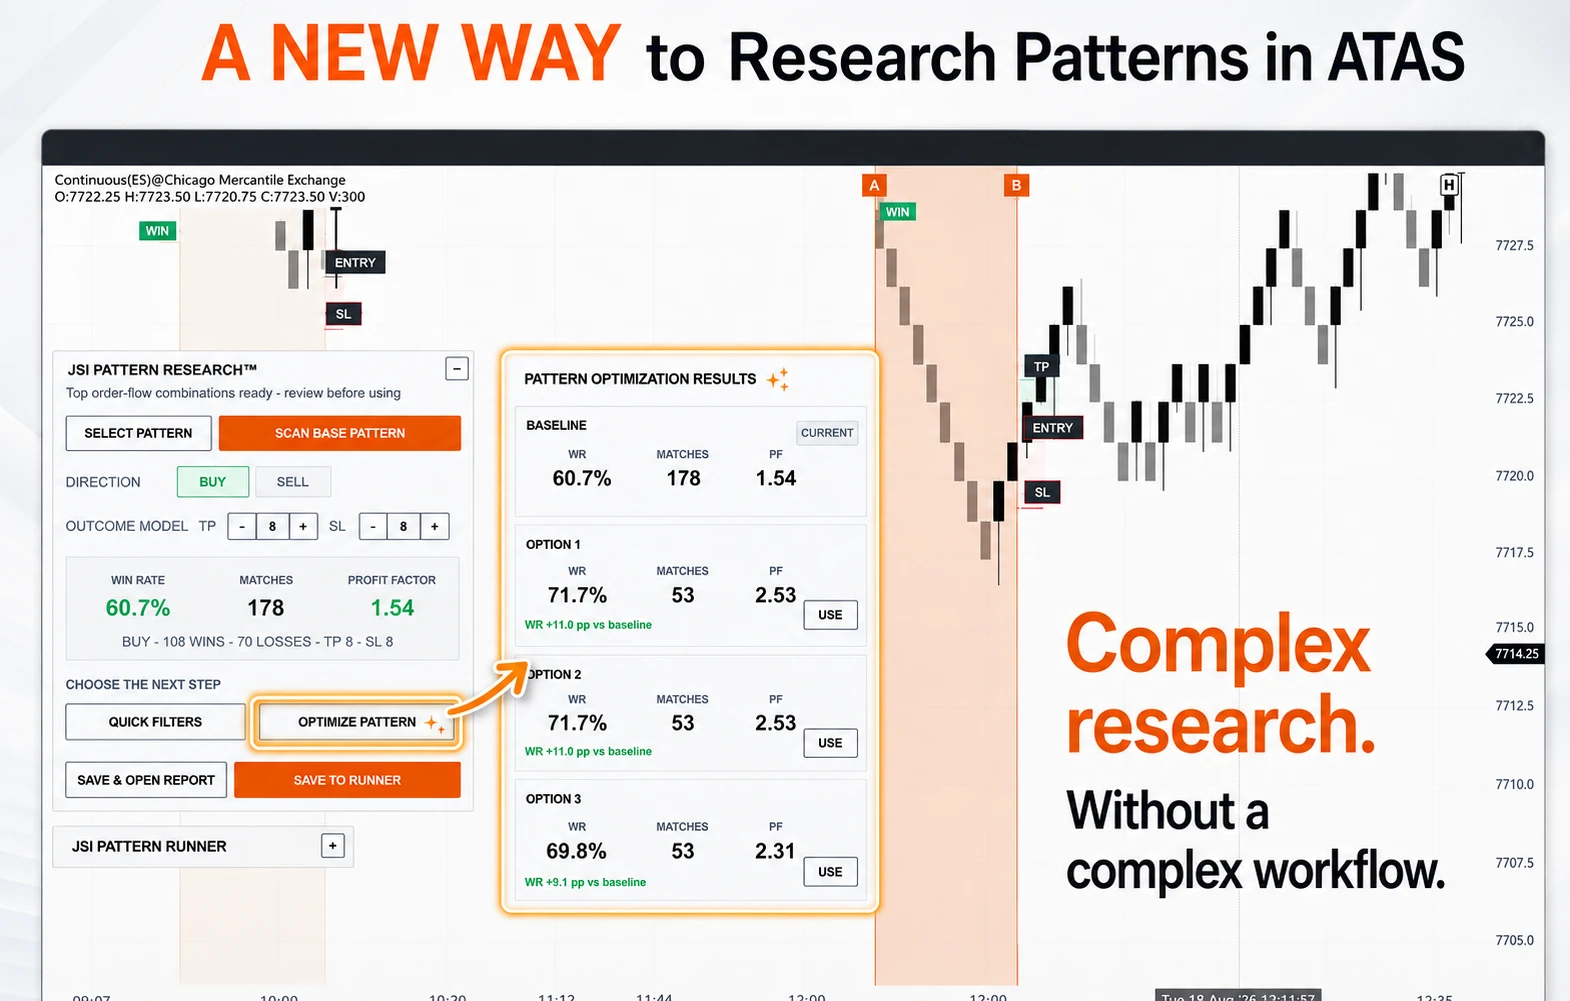
JSI Pattern Optimizer: Automated search for readable candle and order flow refinements.
-
Side-by-Side Comparison: Compare up to three Optimizer alternatives against the baseline setup.
-
Transparent Logic & Reports: View full readable rules alongside detailed historical performance reports.
-
Live Monitoring: Transfer selected logic to JSI Pattern Runner for on-chart visual tracking and real-time alerts.
-
No-Code Engine: 100% transparent rules with zero "black box" code.
How It Works
-
Observation Selection: Select the first and last candle of an interesting sequence directly on your ATAS chart.
-
Outcome Model Setup: Choose Buy or Sell and define your Take Profit and Stop Loss levels — these parameters serve solely to calculate backtest statistics, not to place real orders.
-
Baseline Construction: Pattern Research scans the loaded ATAS history for matching candle sequences and generates baseline metrics: Matches, Win Rate, and Profit Factor.
-
Idea Refinement: Proceed via two paths: use Quick Filters for manual testing of supported candle and order flow metrics (candle structure, Delta, Volume, POC relationships), or launch JSI Pattern Optimizer for automated testing of readable variations.
-
Results Comparison: If valid enhancements are found, Optimizer presents up to three alternatives alongside the baseline version. Compare Win Rate, Matches, and Profit Factor before deciding whether a setup is worth retaining.
-
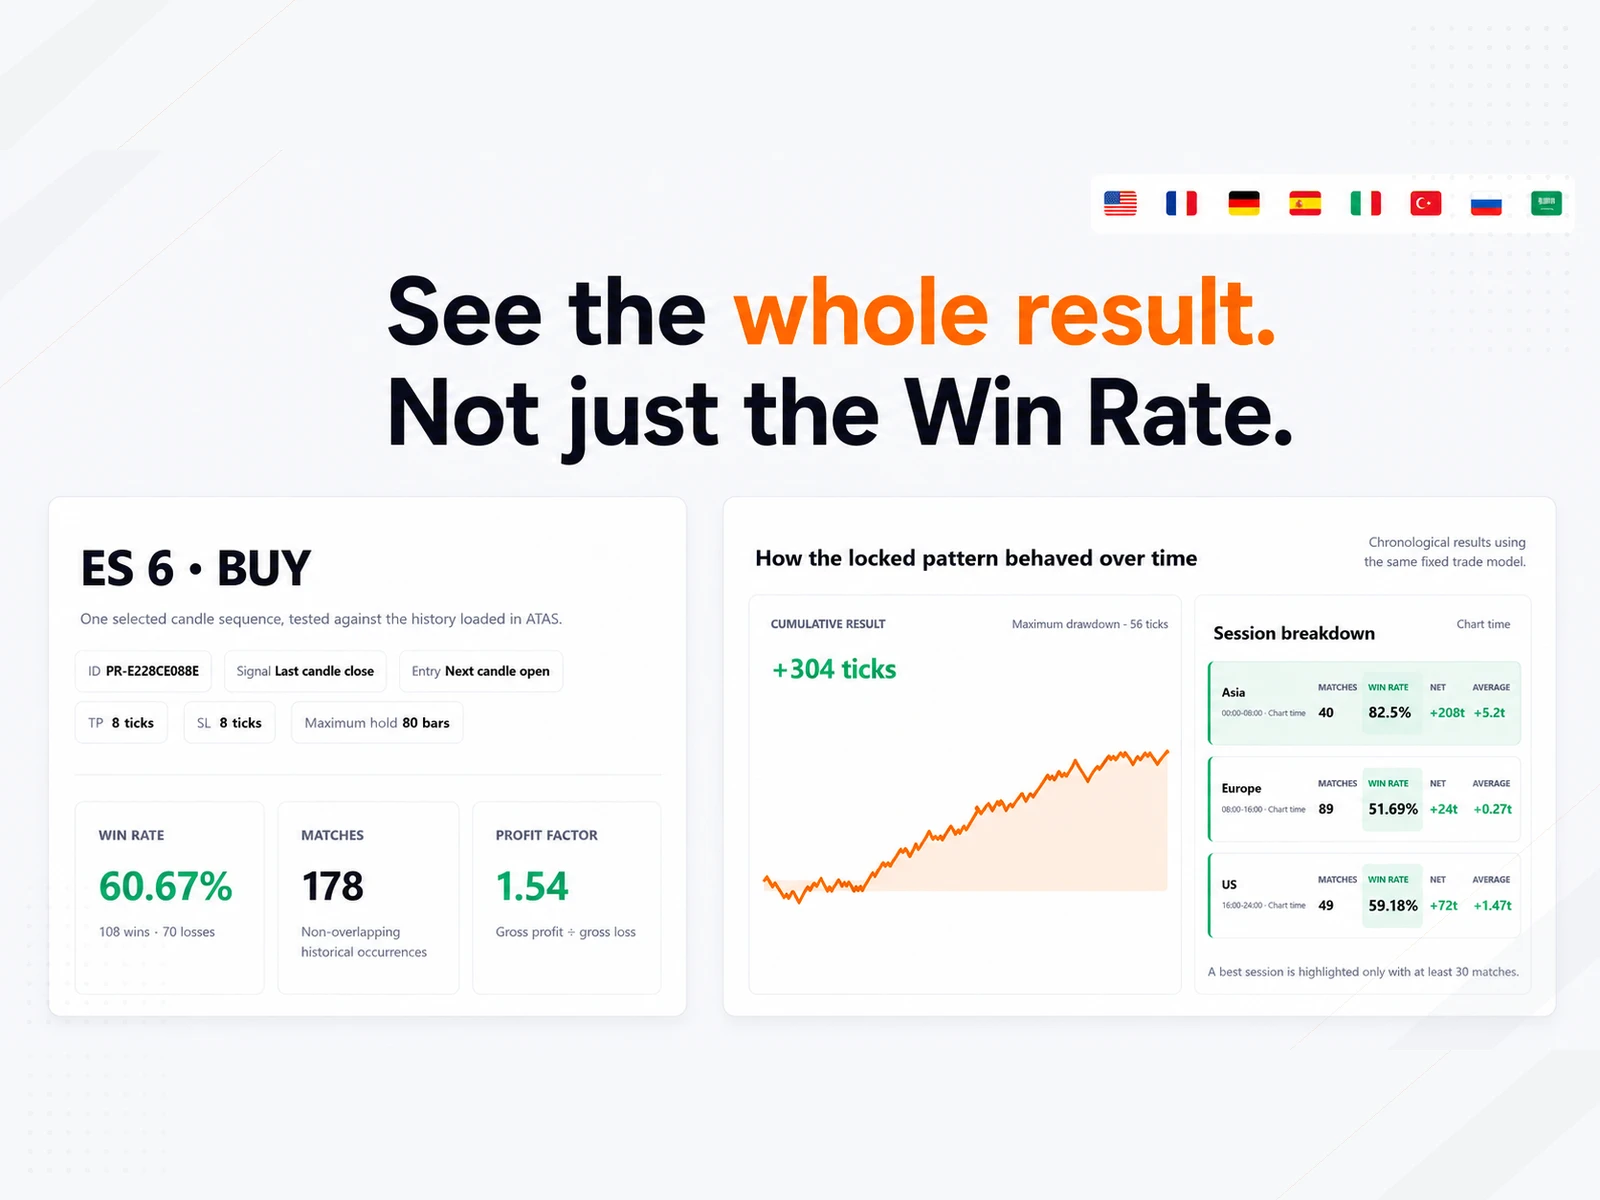
In-Depth Analysis: Open the selected setup in a full report: exact readable rules, performance dynamics over time, session-based breakdown, MFE/MAE analysis, and individual historical trade logs.
Note: Before trusting the numbers, evaluate sample size (Matches) and temporal stability alongside Win Rate — setups over-optimized to small sample sizes may reflect historical curve-fitting rather than repeatable market edge.
-
Live Logic Monitoring: Transfer mature setups to JSI Pattern Runner. Runner monitors newly closed candles, marks matching patterns directly on your ATAS chart, and triggers alerts upon new occurrences.
Note: Research results and available refinements depend on the instrument, timeframe, chart type, and historical data loaded into ATAS.
Settings
-
Pattern Selector: Candle sequence selector linked directly to active ATAS charts.
-
Outcome Model: Buy/Sell direction with customizable Take Profit and Stop Loss values.
-
Research Parameters: Supported scanning and holding rules.
-
Quick Filters: Manual toggles for candle structure, Delta, Volume, POC, and order flow conditions.
-
Optimizer Settings: Controls for automatic candidate generation and side-by-side baseline comparisons.
-
Research Active Selection: Designates which refined version becomes the active monitoring setup.
-
Pattern Runner Controls: Visualization styles and real-time alert triggers for active setups.
FAQ
-
"I keep noticing this candle sequence. How did it perform historically?" Select the sequence directly on the chart, configure your Buy/Sell outcome model, and scan loaded history to reveal Matches, Win Rate, and Profit Factor.
-
"Does the Delta or POC behavior I noticed add actual statistical value?" Test the specific metric via Quick Filters and compare the resulting metrics against the baseline version.
-
"Can I refine a pattern systematically?" Run JSI Pattern Optimizer. It tests supported, readable candle and order flow variations and displays up to three top-performing alternatives alongside your baseline.
-
"Win Rate went up — what changed and how much data is left?" Evaluate Win Rate, Matches, and Profit Factor together, then review the exact readable logic and detailed report — never rely solely on a headline percentage.
-
"I found a version I want to watch in real time." Transfer the logic to JSI Pattern Runner. Runner tracks closed candles, marks future matches, and sends alerts directly within ATAS.
Special Offer
Special terms are available for the ATAS community — use promo code ATASRESEARCH.
JSI develops and provides custom indicators and educational materials for ATAS, specializing in order flow and market analysis tools.
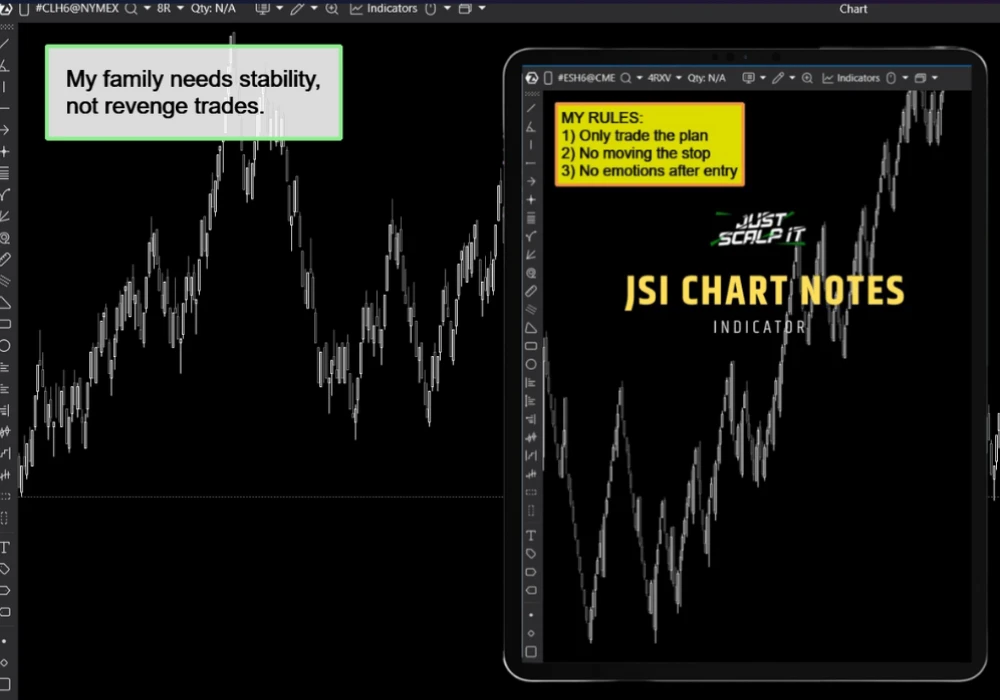
The JSI Chart Notes indicator lets you display your own text directly inside the ATAS chart workspace.
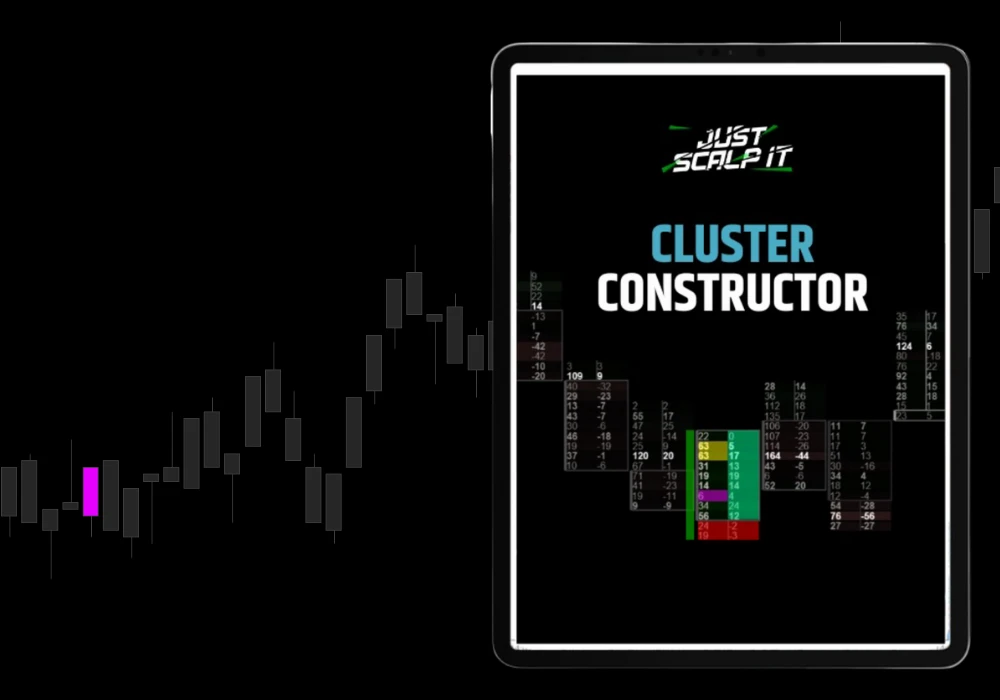
A powerful search engine for your footprint chart. Instead of searching manually, build your own rules from over 15 filters, and let the indicator instantly highlight the exact candles that match your specific criteria.
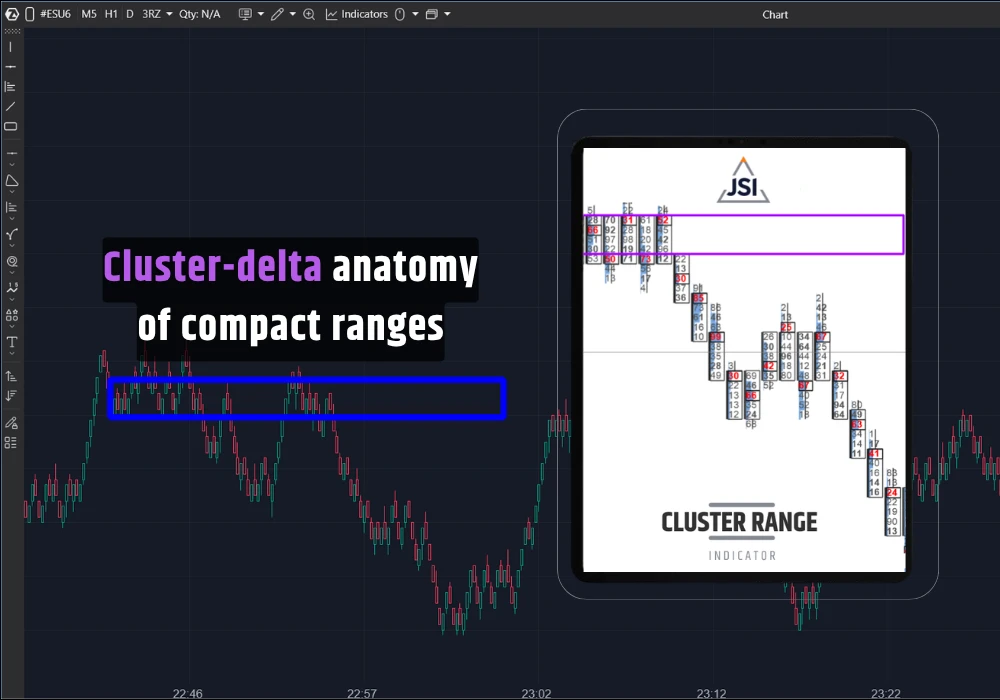
The indicator helps traders analyze compact range areas and range-impulse behavior using user-defined order-flow conditions.
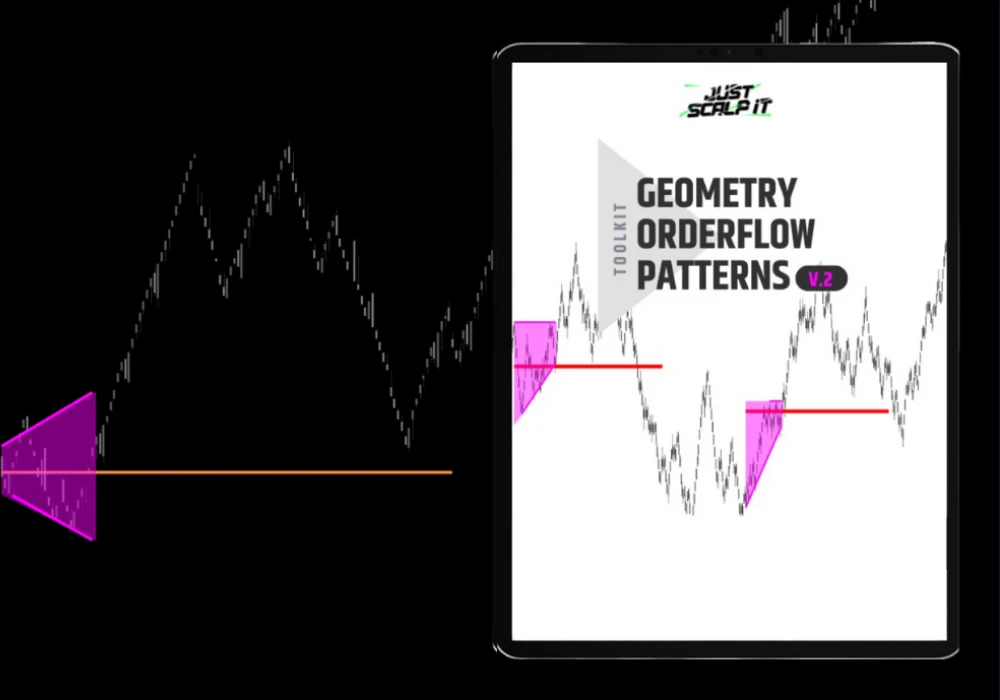
A pattern-recognition indicator that detects market triangles (symmetrical, ascending, descending, expanding) and overlays cluster volume and delta filters inside each shape. Go beyond geometry — analyze order flow context inside patterns.
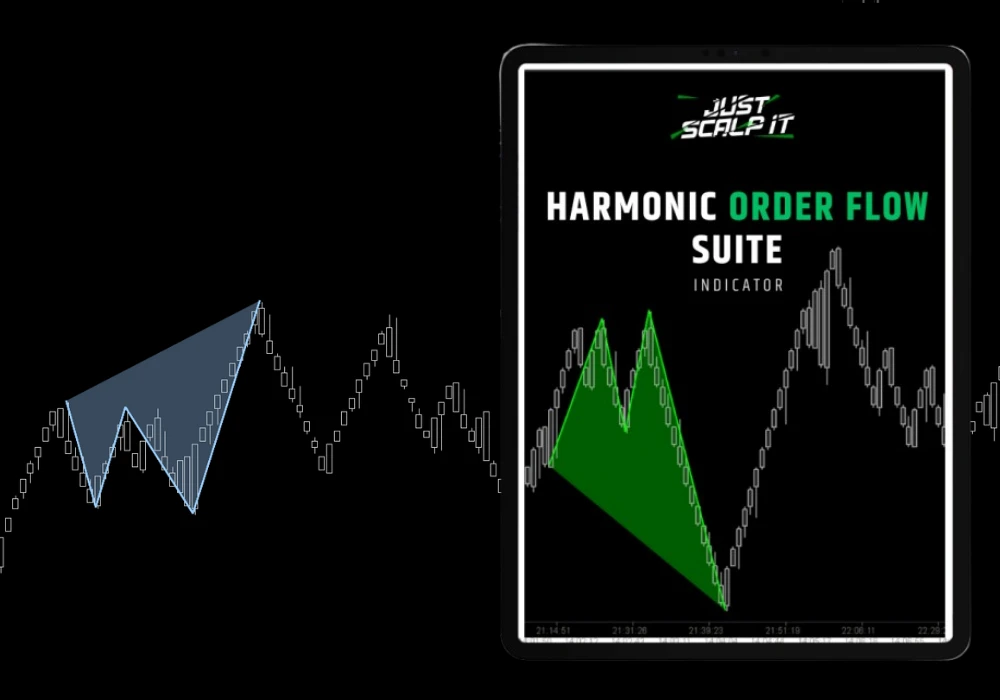
A harmonic pattern detector enhanced with order flow filters. Combine classic geometry with real cluster and delta data for deeper analysis of potential reversals.
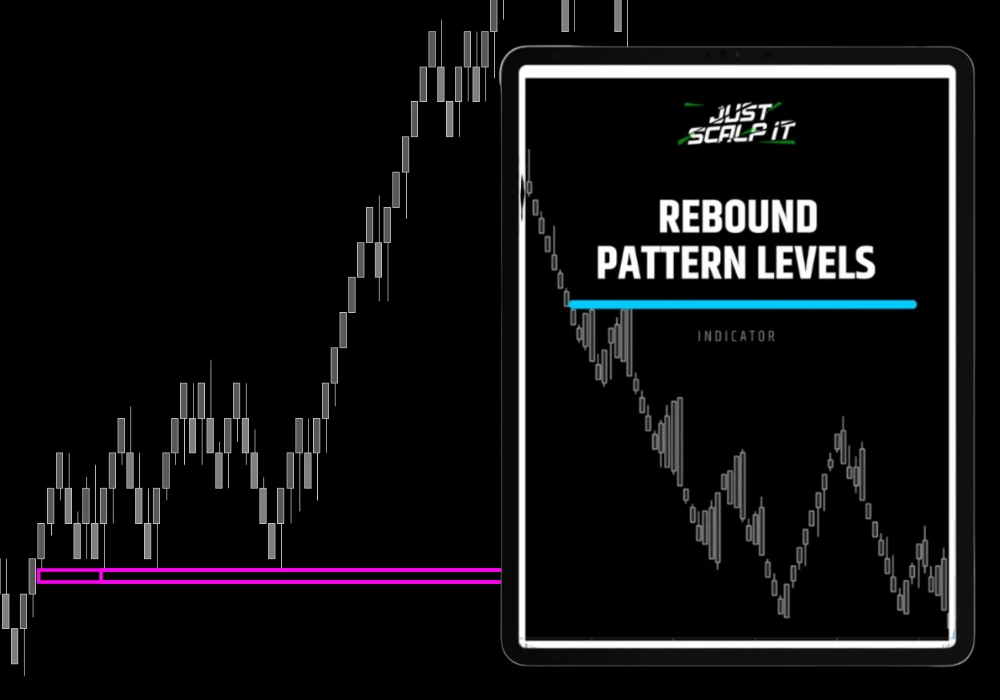
A focused tool for detecting rebound levels with optional delta filters. Helps traders mark structured bounce areas instead of relying on intuition.
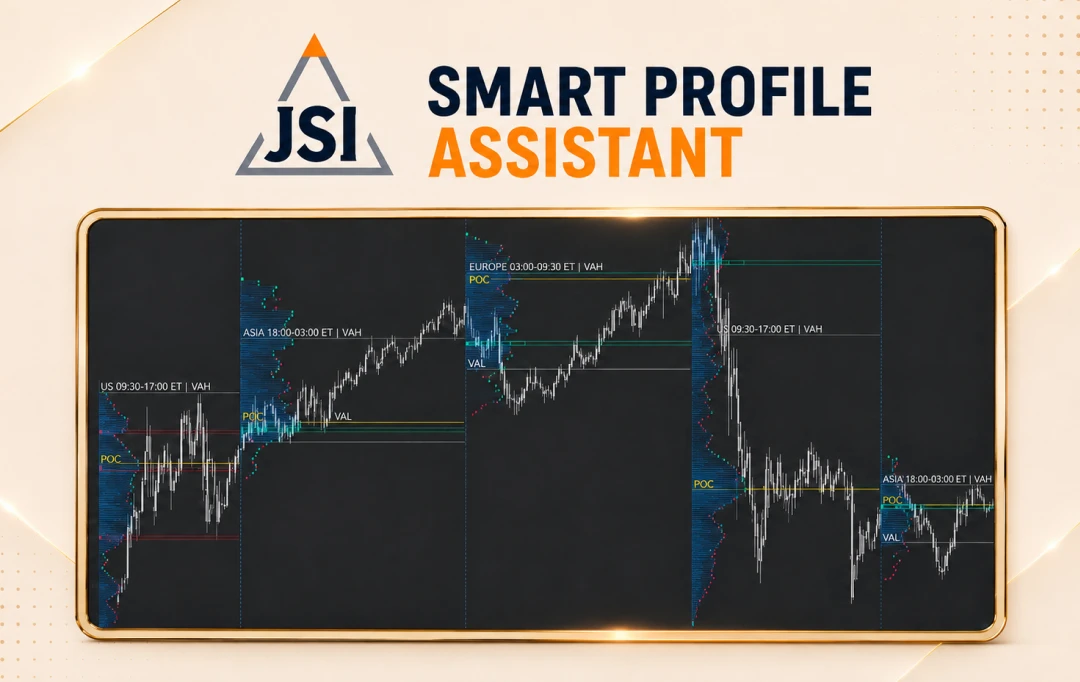
A session-based Volume Profile and order-flow indicator. Helps you organize market structure by session and find significant horizontal zones shaped by volume, delta, and order-flow activity.
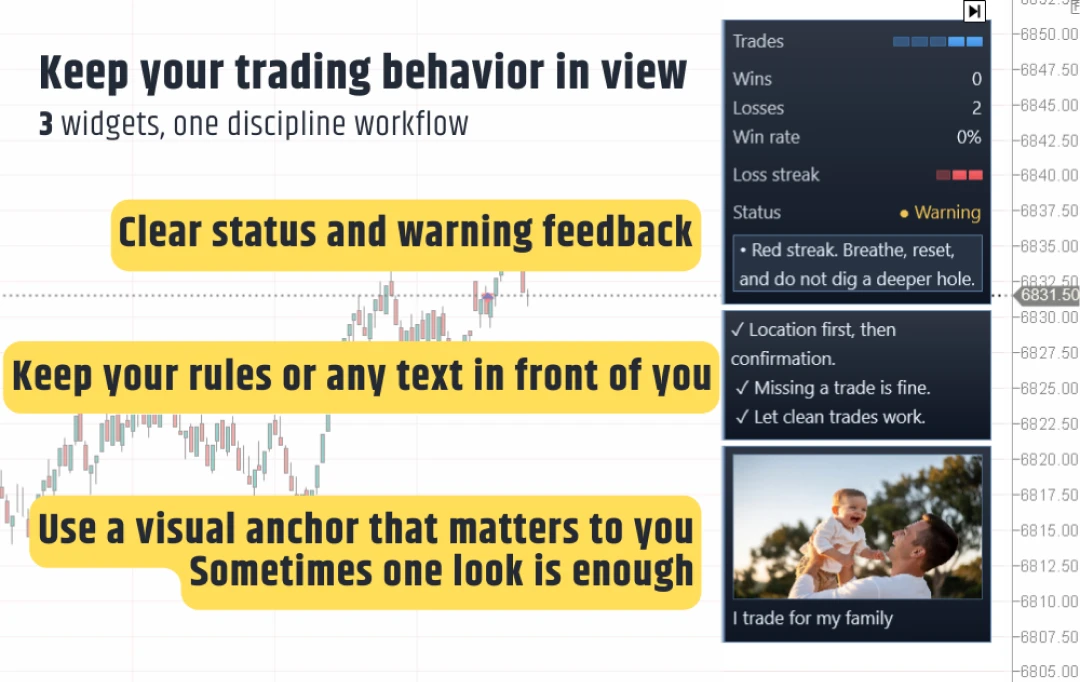
JSI Trade Mirror is a behavioral support widget that keeps discipline metrics, personal notes, and reminder panels visible on the chart — helping traders monitor overtrading, revenge entries, and loss streaks in real time.
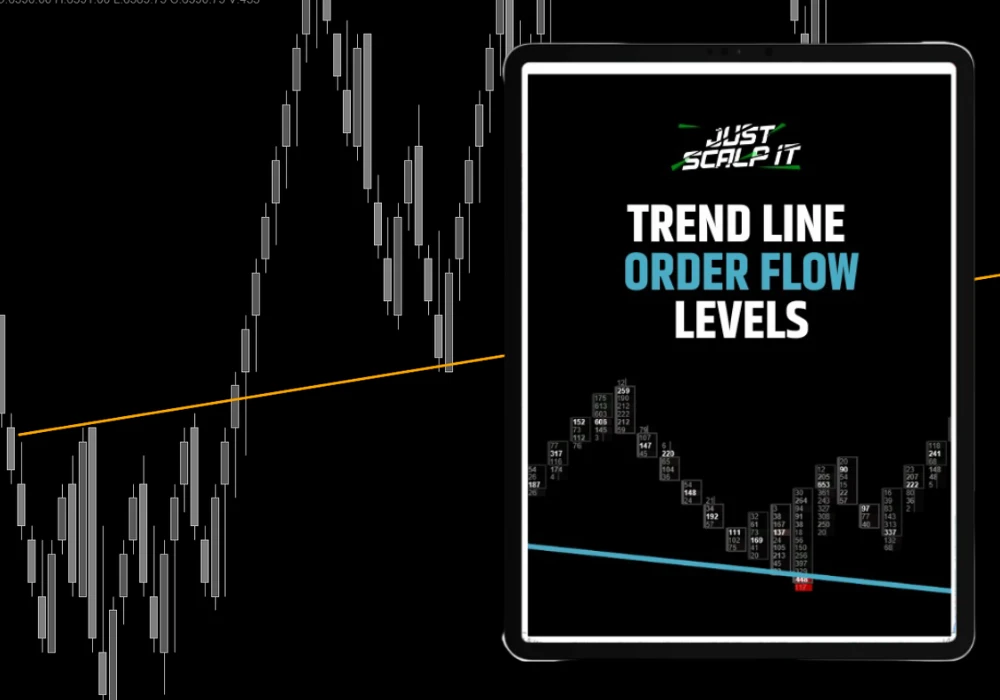
Trendline indicator that detects two- and three-touch price-reaction structures. Apply delta and volume thresholds to highlight lines backed by meaningful order-flow activity.
JSI develops custom indicators and trading bots for ATAS, built around what you want to track or automate on the analytics platform. Projects are accepted only when the required behavior is clearly defined and reliably implementable.