
 Publication:26.08.2026
MACD Zero Lag
- Category: Algotrading
- Asset class: Futures, Stocks, Cryptocurrencies
Description
Classic MACD is familiar, but it has a weak spot: the line often turns only after the move is already underway. MACD Zero Lag tackles exactly that — it uses Zero-Lag EMAs (Ehlers-style) to calculate the main line, so zero-line and signal crossovers typically show up earlier than with a regular MACD.
Honest heads-up: earlier doesn't mean free of trade-offs. A faster line means more noise and more false crossovers. This isn't "MACD, but better in every way" — it's a different balance between speed and precision, and it's up to you to decide what fits your style.
The indicator visualizes momentum. It is not a buy/sell system and not financial advice — you interpret it independently as part of your own analysis.
What You See on the Chart
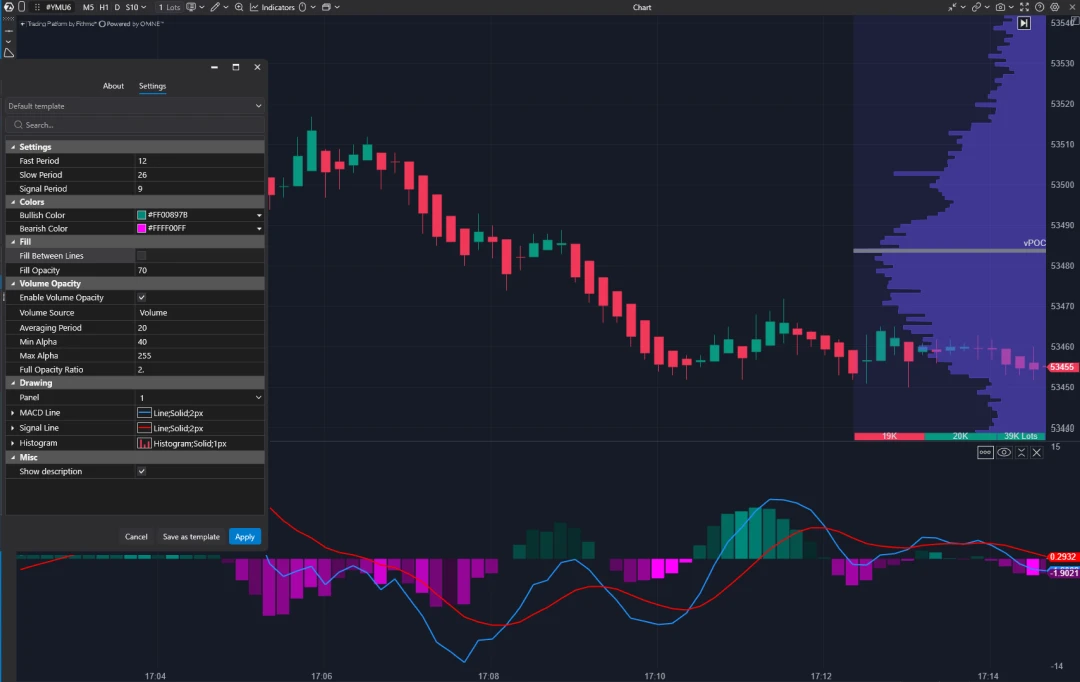
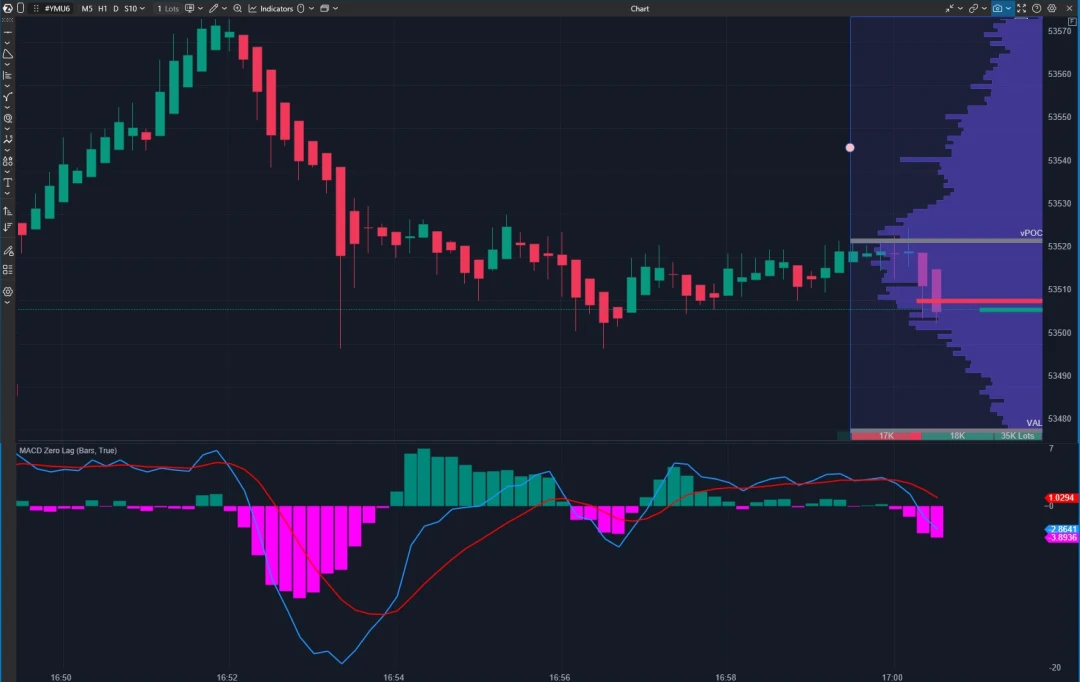
Three elements are plotted in a separate panel below price:
- MACD line — zero-lag, typically turns earlier than the standard version.
- Signal line — a regular EMA of the MACD line. Important: the signal line itself is not accelerated — its lag stays the same as always, and that's expected.
- Histogram — the difference between MACD and Signal, colored by sign (teal above zero, magenta below). The color doesn't flip just because a bar is shrinking — only when the histogram itself crosses zero.
Defaults are the familiar 12/26/9. Add it to a chart and it works immediately, with no extra setup required.
Two Optional Extras
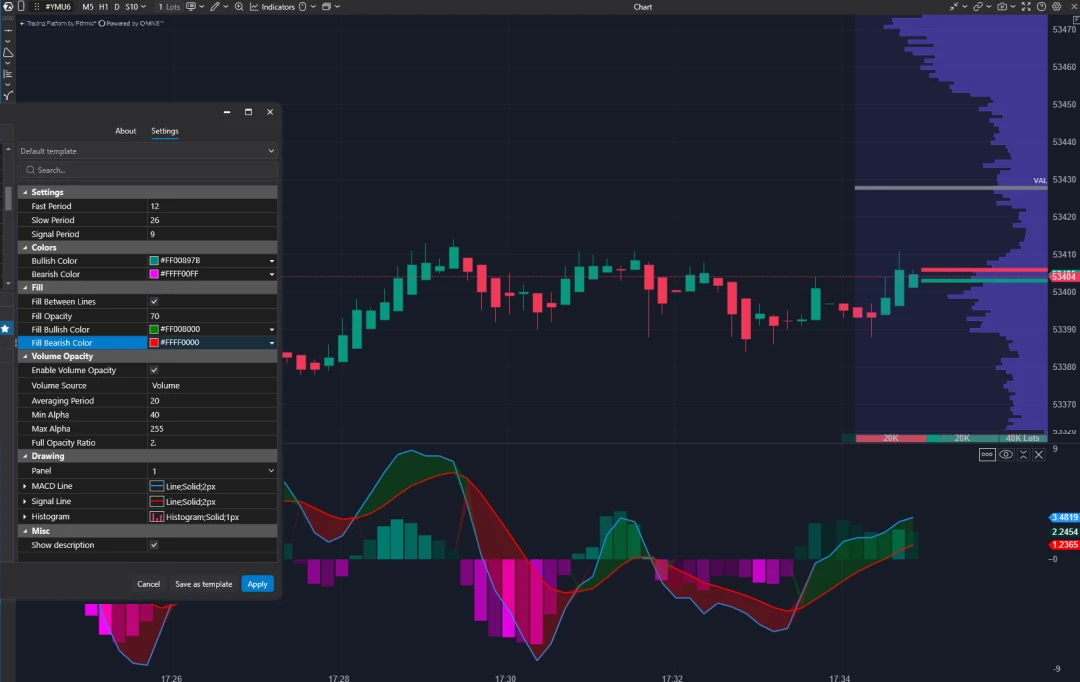
Fill between the lines. Shows the gap between MACD and Signal as a shaded area — bullish color when MACD is above Signal, bearish when below. It's purely a visual layer on top of the same values; it doesn't affect the math. Off by default.
Volume opacity. Lets you see how much activity is behind each histogram bar: the higher the volume (or delta, ticks, bid/ask volume — your choice), the more solid the bar looks; the lower, the more faded. Bar height doesn't change, only its intensity. Off by default.
Two Things to Know Before You Use It
- This isn't the same "Zero Lag MACD" used on other platforms (including many TradingView scripts) — those use a different, double-EMA construction. Values won't match charts from elsewhere — that's not a bug, just a different algorithm.
- Zero-lag applies only to the MACD line. The signal line is a regular EMA and still lags, as always. The indicator doesn't remove lag from MACD as a whole and isn't a complete strategy on its own.
Using It in Practice
- Earlier MACD/signal crossover — the same logic as classic MACD, but the line usually turns a bit sooner. Extra crossovers are the price of that speed.
- Fading without a color flip — the histogram is still positive but shrinking: expansion reads as strengthening momentum, contraction as fading, regardless of color.
- Volume filter — solid bars point to higher activity behind the same MACD reading, faded bars to quieter activity. Use it as extra confirmation, not as a standalone signal.
- Fill as a visual of the gap between MACD and Signal — same information, just easier to see at a glance.
- Divergence — price makes a new high/low while MACD or the histogram doesn't. Because of the zero lag, these divergences can show up earlier — and also fail more often.
These are ways to read the panel, not ready-made entry rules. The indicator is not a standalone signal.
Settings
- Periods: Fast (12), Slow (26), Signal (9) — range 1–10000. Slow must stay greater than Fast, or the MACD sign inverts.
- Histogram colors: separate colors for bullish (default teal) and bearish (default magenta) — these don't affect the fill.
- Volume opacity: source (volume, delta, ticks, bid/ask), averaging period, min/max opacity — all adjustable manually.
- Fill: its own bullish/bearish colors, opacity defaults to 70.
⚠️ Histogram Width must stay at 1 — otherwise ATAS draws a thin line instead of a solid bar. That's how ATAS renders histograms, not a bug in the indicator.
Installation
- Download the
.dllfile. - In ATAS: Indicators → add → select the downloaded file.
- Update the indicator list / restart ATAS if prompted.
- Add it to a chart — it appears as "MACD Zero Lag."
- Configure periods, colors, fill, and volume opacity to your liking.
Works with any instrument and any ATAS timeframe that has a Close price. No extra data feeds required.
Technical Details
Platform: ATAS v8+ · Language: C#, .NET · Version: 0.4.2 · © 2026 MazingerK
For anyone who wants the exact formula: MACD = Fast ZLEMA − Slow ZLEMA, where both ZLEMAs are built on Close with lag (Period − 1) / 2. Source is 2 × Close − Close[lag] when enough bars exist, otherwise just Close.
An independent trader and developer building custom indicators for ATAS. Development focuses on practical intraday tools that automate chart preparation and highlight session structure, with an emphasis on clean visual design and full configurability.
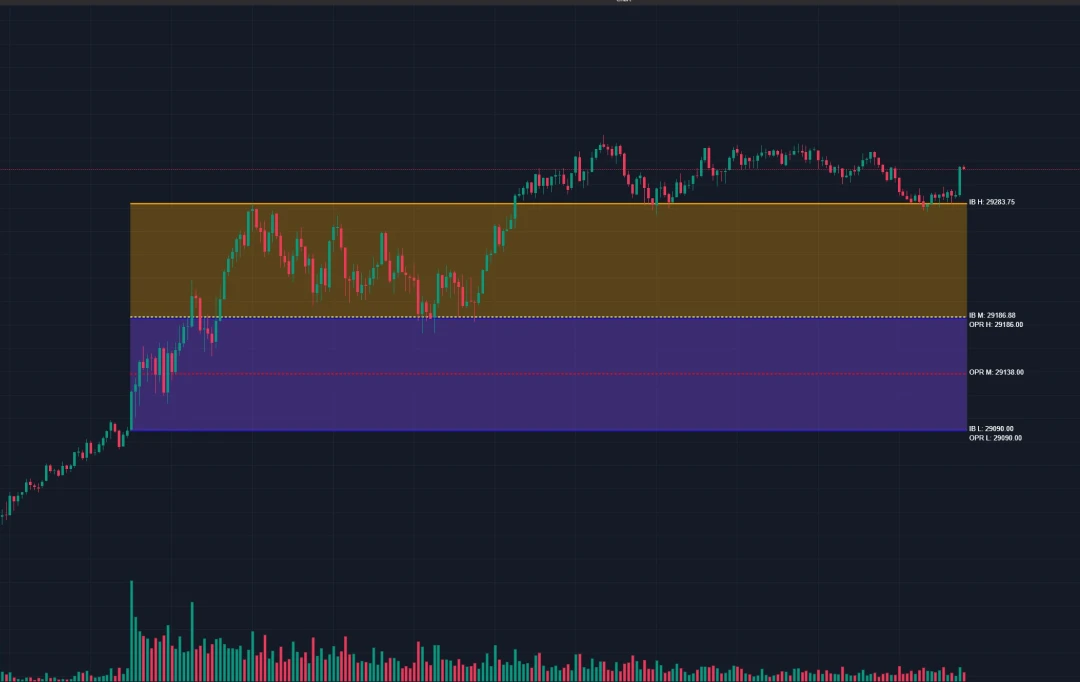
Enhanced OPR + IB — a free ATAS indicator: tracks and visualizes the Opening Price Range and Initial Balance across configurable sessions (US, Eurex, Asia, or Custom) — high/low/mid lines, extension levels, and filled zones on the chart.