EN
ATAS MarketplaceWhere Traders and Trading Solutions Meet
Filters
Sort:
By name
By date

Indicators

image

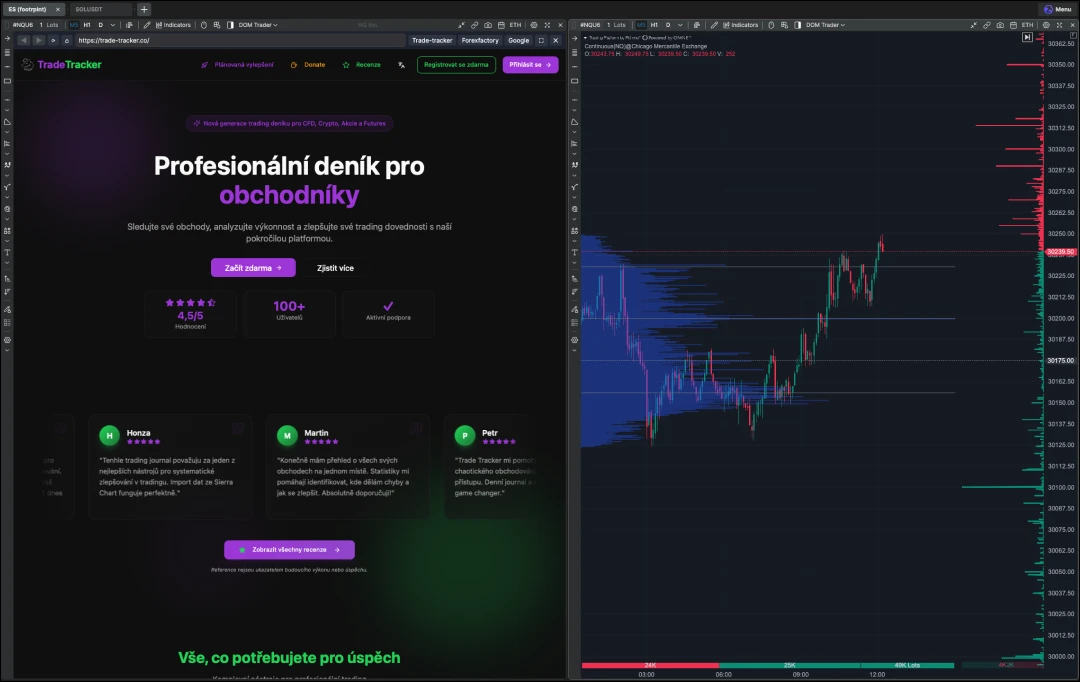
Web Browser Panel (Mac & Windows)

Full-featured web browser directly inside ATAS (Mac & Windows): fast tabs for your favorite sites, convenient for reading market news and maintaining a trading journal. Keep all your essential web tools right alongside your charts.

Category:Indicators
FREE
image

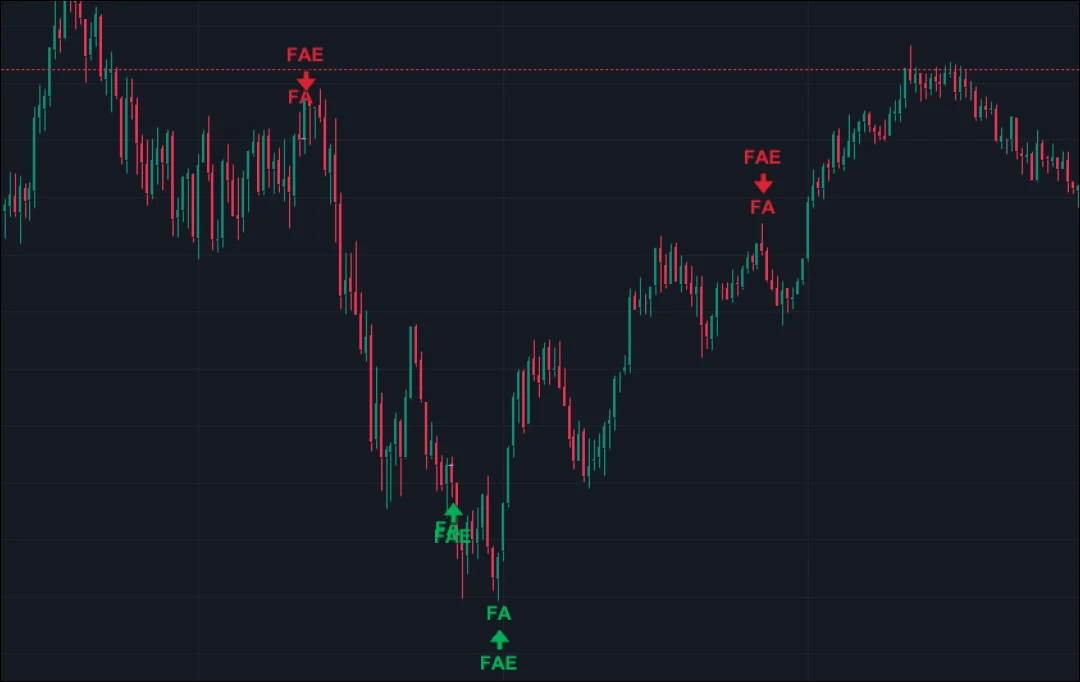
Failed Auction

Failed Auction indicator for ATAS X: detects failed auctions (FA/FAE) where market movement stalls at extremes. Plots clear markers on highs and lows to highlight exhaustion zones and key reference points for potential reversal trades.

Category:Indicators
FREE
image

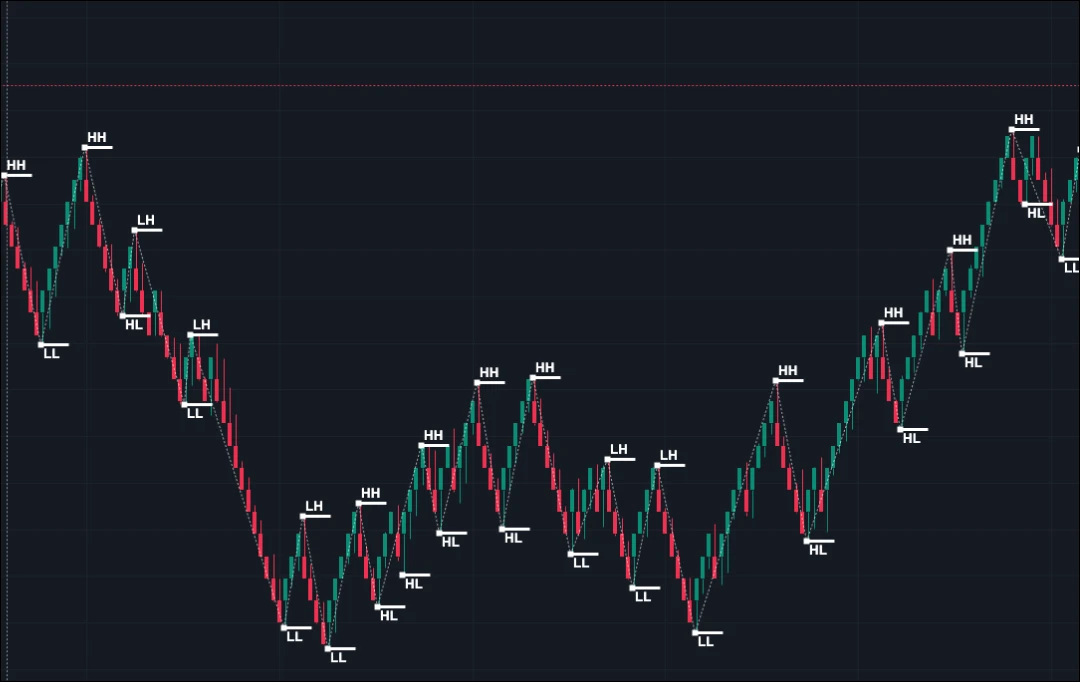
Market Structure

Market structure indicator for ATAS X: automatically labels HH, HL, LH, and LL swing points on your chart. Instantly map market structure, identify potential trend shifts, and maintain clean visual charts across any timeframe.

Category:Indicators
FREE
image

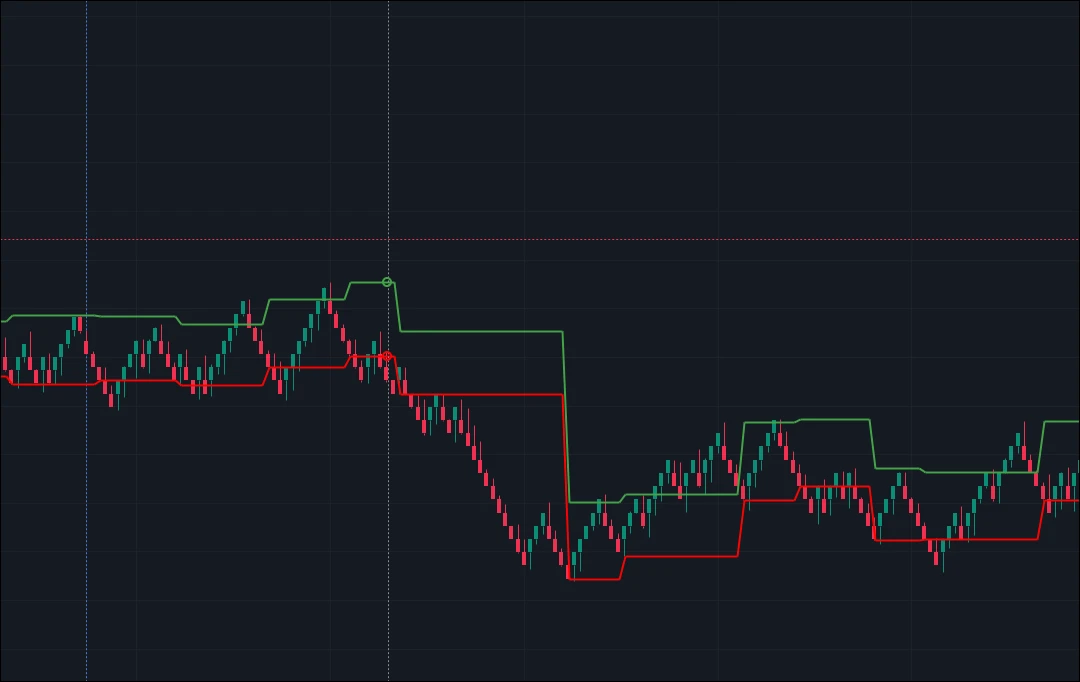
Darvas Box

Darvas Box indicator for ATAS X: automatically plots dynamic Darvas Boxes to identify trends and breakouts. Highlights upper/lower breakout boundaries and trend direction with custom color coding across any instrument or timeframe.

Category:Indicators
FREE
image

VIX Table

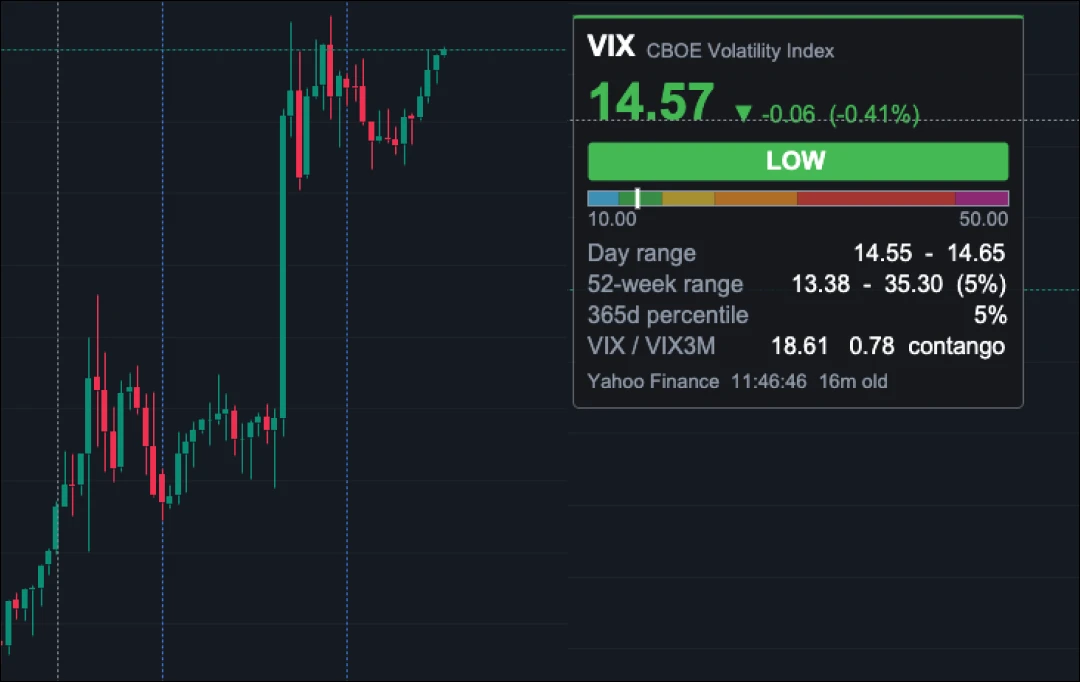
Live VIX volatility overview on your chart: current value, daily change, daily & 52-week range, 365-day volatility percentile, and VIX/VIX3M contango/backwardation. Essential visual context for tracking broad market sentiment in ATAS X.

Category:Indicators
FREE
image

Higher Timeframe Candles & Volume Profile

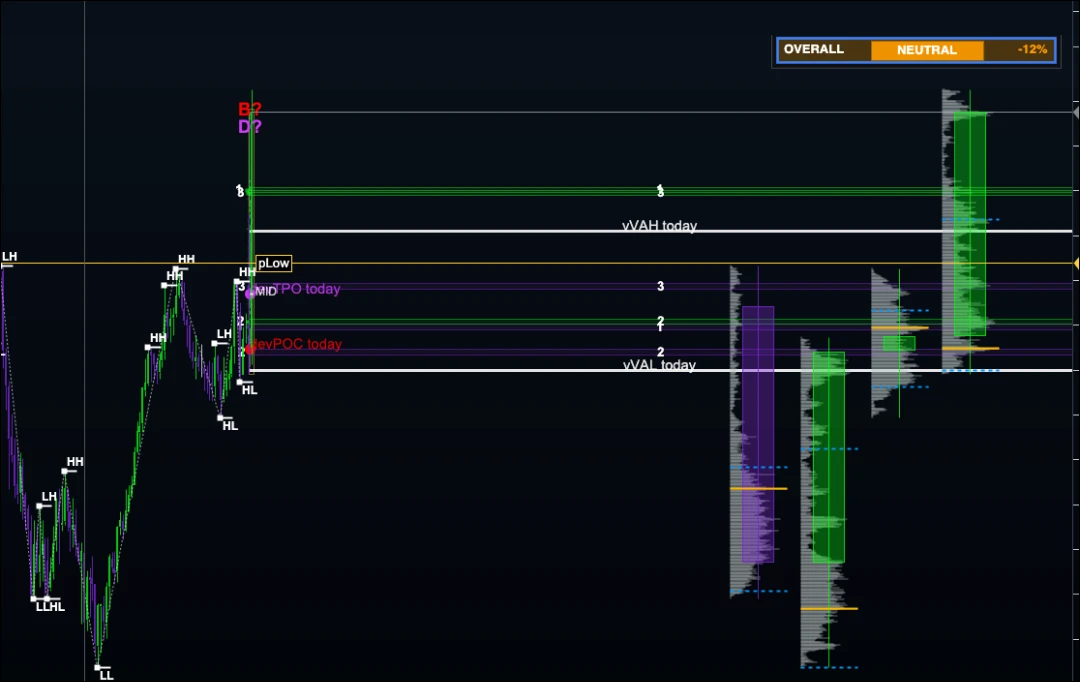
Higher timeframe indicator: displays higher timeframe candles along with their Volume Profile directly on your chart. View broader market context and key volume levels without constantly switching between timeframes in ATAS X.

Category:Indicators
$89
image

Equal Highs & Lows

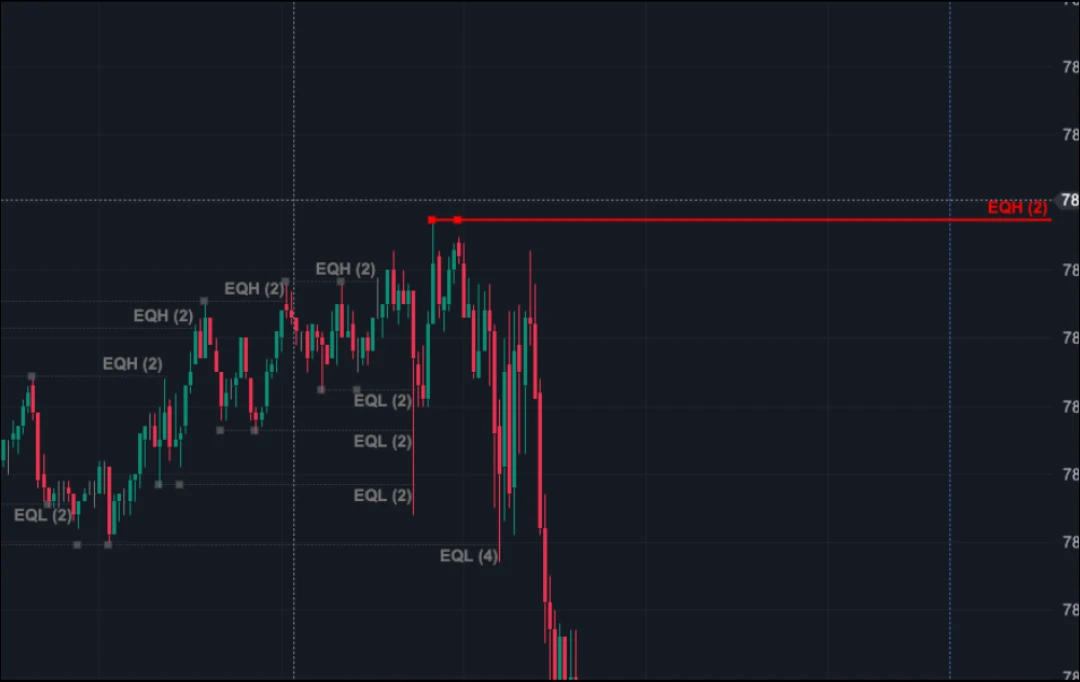
Market structure indicator for ATAS X: automatically identifies and highlights equal highs and lows on the chart — potential liquidity concentration zones and key reference points for sweeps, breakouts, and reversals.

Category:Indicators
$20
image

Volume Extremes & Setup Markers

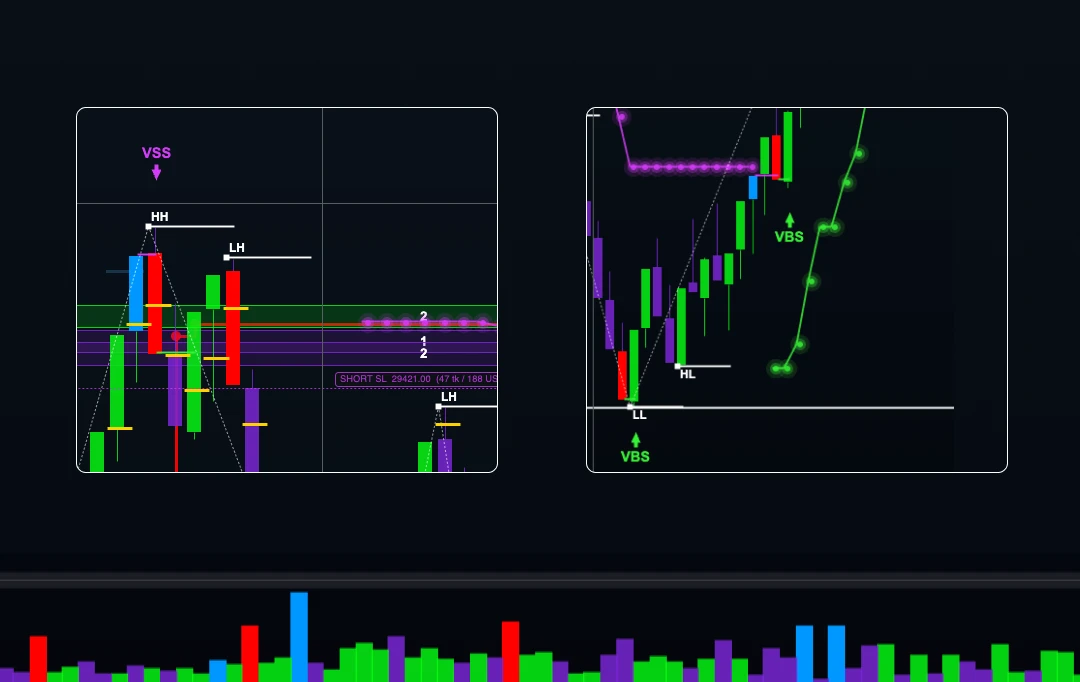
Volume-based indicator: identifies candles with abnormally high volume relative to historical values and highlights on the chart moments when specified volume conditions coincide.

Category:Indicators
$114
image

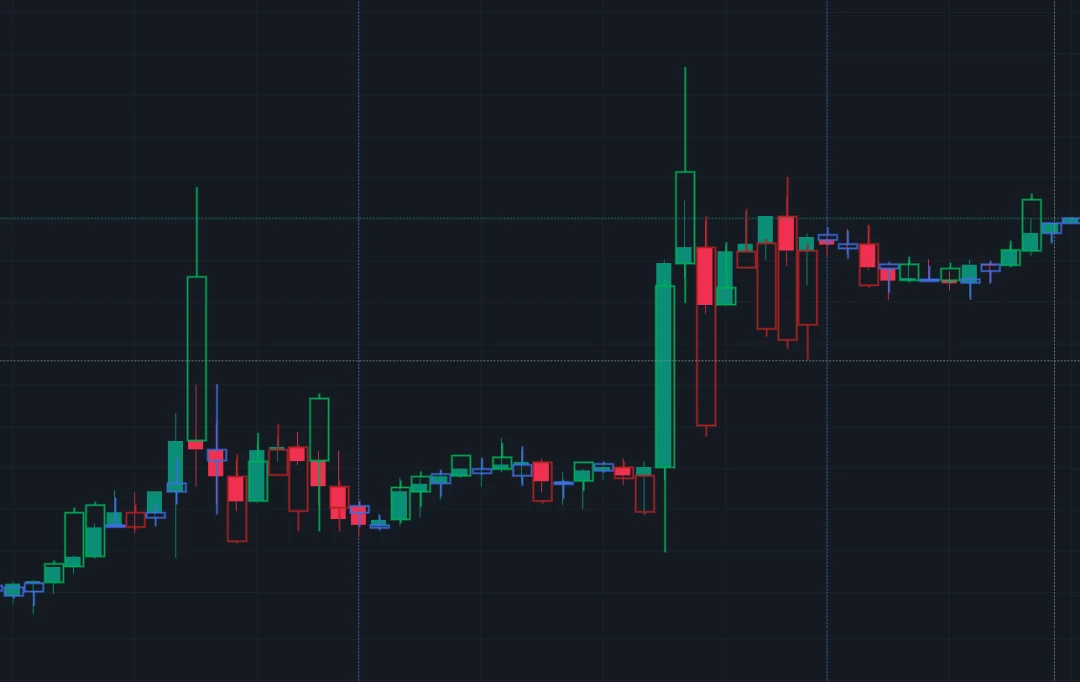
Absorption Candle

An order flow visualization indicator: it reshapes each candle based on its delta instead of the actual price range, helping you spot absorption — when aggressive orders are absorbed by passive liquidity without price moving.

Category:Indicators
$67
image

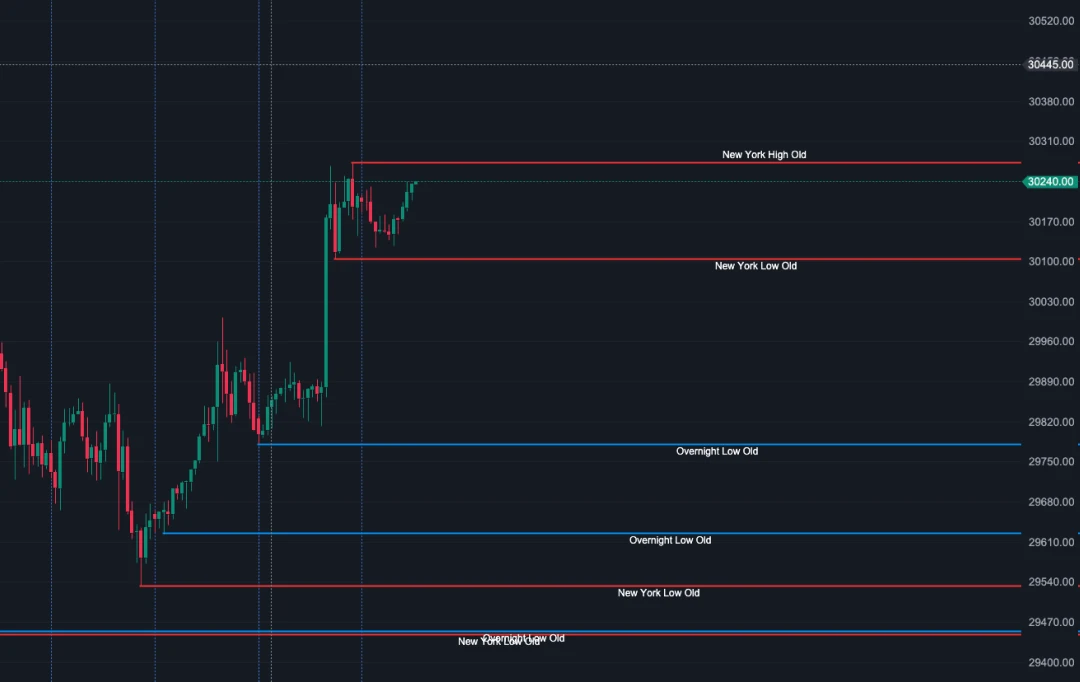
Untested Sessions Levels (NY, London/Overnight and Asia)

Track untested High and Low levels from NY, London/Overnight, and Asian trading sessions. A clean visual tool for ATAS to help traders identify key session boundaries, potential liquidity pools, and historical price reaction zones.

Category:Indicators
$68
image

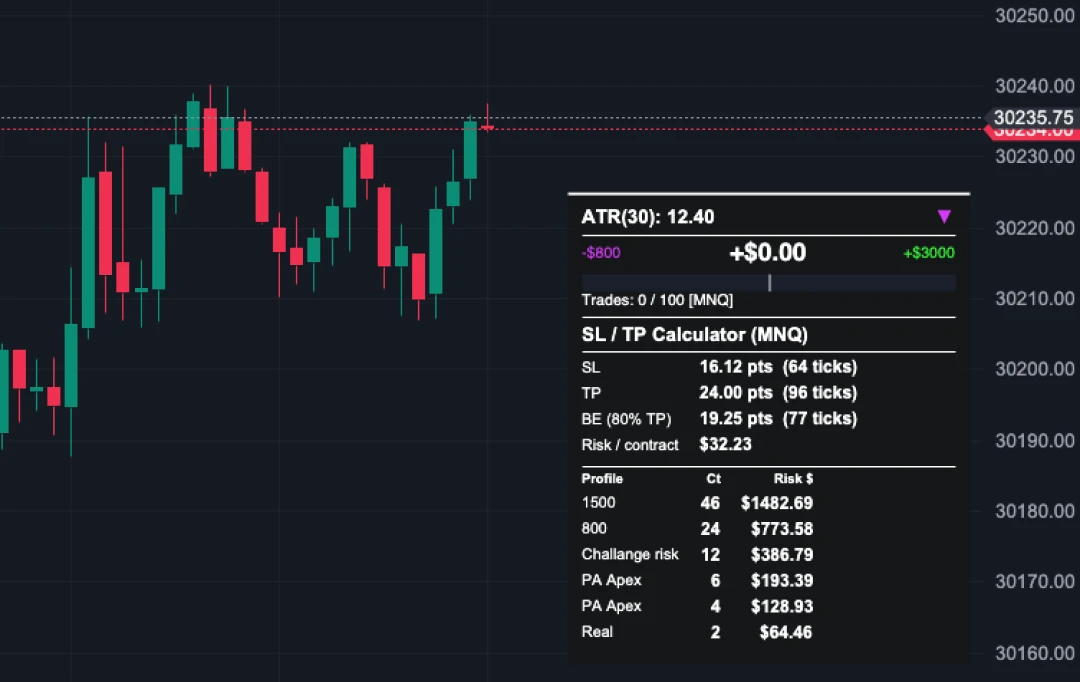
ATR Risk Calculator and Manager

An ATR-based position sizing and risk management indicator: automatic position sizing, ATR-based risk calculation, current and historical ATR modes, and a custom risk amount.

Category:Indicators
$135
image

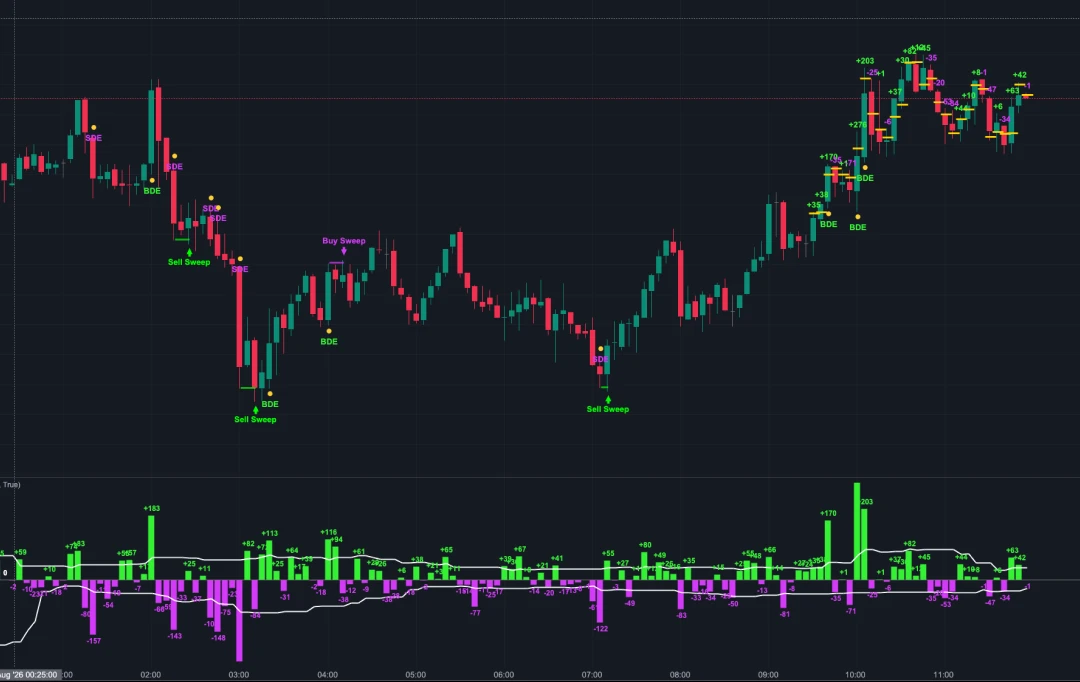
Delta Analysis Suite Pro

An order flow indicator built on candle delta: candle delta, average buy/sell delta, delta extremes, and absorption. Helps you tell normal activity apart from abnormally aggressive buying or selling.

Category:Indicators
$249
Frequently asked questions:
Do I need to register on the Marketplace to access products?
Are there any extra fees or hidden costs?
The product page doesn’t open, or the link doesn’t work – what should I do?
Can I leave feedback or report problems with the product?

Custom Indicators for Trading: Enhance Your Market Analysis

The "Indicators" section of the ATAS marketplace offers ready-made solutions for traders seeking powerful custom analytical tools. It features trading indicators that aren't available in the standard ATAS package but can be easily integrated via the API. This is a convenient place to discover carefully selected trading indicators that enhance various strategies.

Why Choose Custom Indicators in Trading?

  • Non-Standard Algorithms. Each of the trading strategies & indicators is developed based on original ideas and complex algorithms. They provide in-depth analysis, allowing you to surface additional market details. On our marketplace, you’ll find specialized volume analysis tools as well as some of the best technical indicators for a comprehensive approach to market analysis.
  • No need for complicated setup. You can download and integrate indicators into ATAS right away. Even if you’re new to trading with indicators, you’ll find guidance to get up to speed and apply concepts in your study and analysis.
  • Market-focused. Use these tools to structure routine tasks within your workflow and to define research conditions for your strategies. Here, you'll find top trading indicators designed to streamline your workflow.

Expand Your Toolset. Start using the power of automation to support and systematize your analysis. You can buy trading indicators by visiting our partners' websites, and even find free trading indicators to download at once.

The best indicators for trading are those that perfectly align with your specific strategy. If ready-made solutions don’t meet your needs, the "Developers" section is always available to help turn your unique idea into a custom-built indicator.

Disclaimer: Developing analytical skills does not eliminate trading risks or guarantee performance. All trading decisions remain the sole responsibility of the user.