
 Publication:31.07.2026
Flow Scanner Pro
- Category: Algotrading
- Asset class: Futures, Stocks, Cryptocurrencies
Description
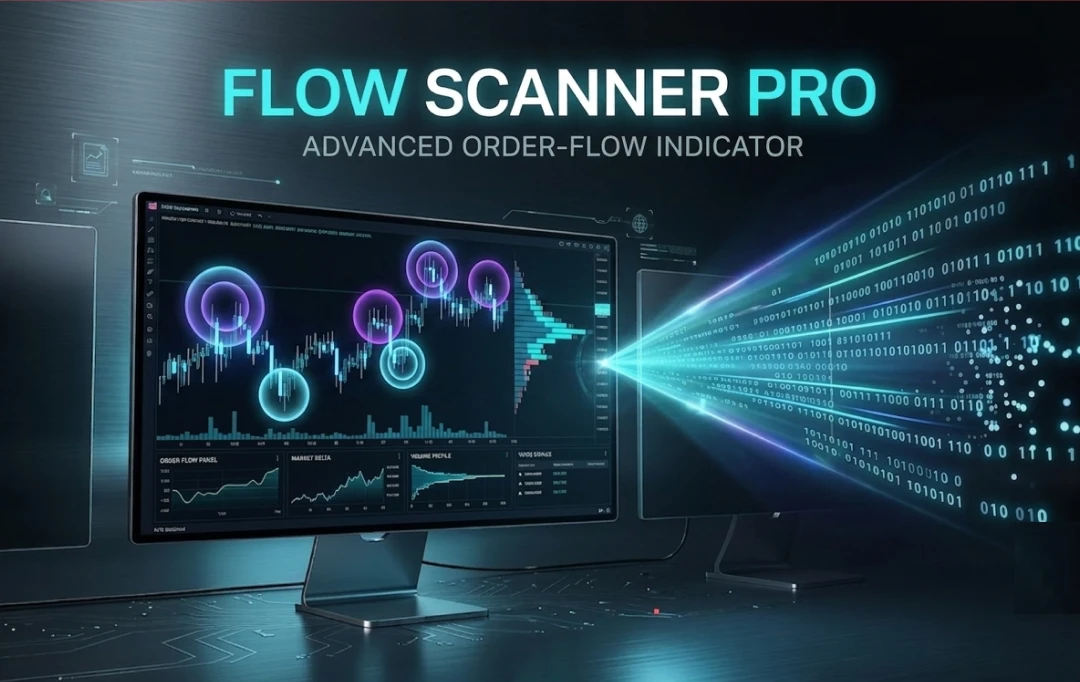
Volume-based Order Flow indicator with adaptive statistical auto-filtering. Detects large block trades and significant volume anomalies, then automatically maps them as potential dynamic support and resistance zones on the chart. Combines cumulative and separated trade analysis with multi-mode price-location classification (Body, Wick, High, Low).
Flow Scanner Pro combines a range of advanced analytical capabilities in a single indicator:
1. Advanced Candle Anatomy Filtering
Beyond detecting large-volume events, the indicator identifies where within a candle they occurred — Body, Wicks, High, or Low. Each location can be configured independently, helping traders analyze potential absorption, price rejection, and execution patterns associated with large market participants.
2. Adaptive Statistical Auto-Filter
Instead of fixed thresholds, Flow Scanner Pro uses a statistical filtering engine based on the mean and standard deviation of the top 20% of historical volume distribution. Three sensitivity levels (Soft, Medium, Hard) automatically adapt the threshold to changing market conditions without manual adjustment.
3. Automatic S/R Zone Builder
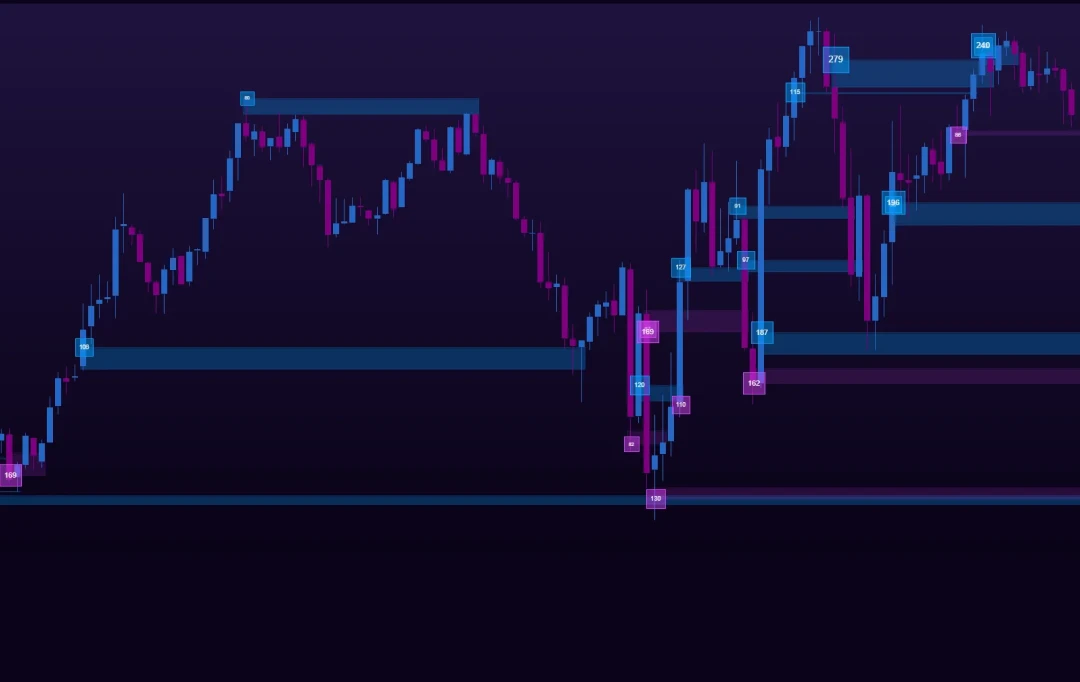
Qualified volume events are automatically converted into dynamic support and resistance zones. Users can choose how zone prices are calculated (Last, Start, Weighted Average, or Start-to-Last), providing additional market context based on significant historical trading activity.
4. Automatic Zone Lifecycle Management
Support and resistance zones are automatically invalidated using configurable rules, including touch detection, candle body or wick crosses, three-touch validation, or bar-count expiration, helping keep charts relevant and uncluttered.
5. Dual Trade Calculation Engine
Supports both Cumulative Trades (block trade reconstruction) and Separated Trades modes, providing flexibility across different market data feeds and trading workflows.
6. Up to Five Independent Filter Profiles
Run up to five fully independent scanning profiles within a single indicator instance. Each profile has its own volume filters, price-location rules, visualization settings, and support/resistance configuration, reducing the need to run multiple indicator instances while keeping charts organized.
7. Compatible with ATAS Classic and ATAS X
Flow Scanner Pro automatically detects the runtime environment at startup and adapts its rendering pipeline accordingly, ensuring consistent operation across both platforms.
How It Works
Flow Scanner Pro processes both real-time and historical order flow data through a multi-stage analytical pipeline.
Stage 1 — Data Ingestion
The indicator captures raw market data in either Cumulative Trades mode (reconstructing larger trades from grouped ticks) or Separated Trades mode (processing each trade independently). Historical data is loaded for a user-defined period to establish a statistical baseline for volume analysis.
Stage 2 — Volume Filtering
Each trade is evaluated against a configurable volume threshold.
In Manual mode, users define explicit minimum and maximum volume values.
In Auto mode, the indicator analyzes the top 20% of the historical volume distribution, calculates the mean and standard deviation of that dataset, and automatically derives a dynamic threshold:
- Soft: μ + 0.5σ
- Medium: μ + 1.5σ
- Hard: μ + 3.5σ
This approach automatically adapts to changing market conditions without requiring manual threshold adjustments.
Stage 3 — Price Location Classification
If enabled, each qualifying trade is evaluated against the structure of its candle.
Based on the selected execution price reference (Last, Start, or Weighted Average), the indicator determines whether the trade occurred within the candle body, wick, high, or low. Only trades matching the configured location criteria are included in the analysis.
Stage 4 — Time Filtering (Optional)
Users can restrict analysis to a specific trading session or custom time window, allowing the indicator to focus on periods of interest, such as the New York market open.
Stage 5 — Visual Rendering
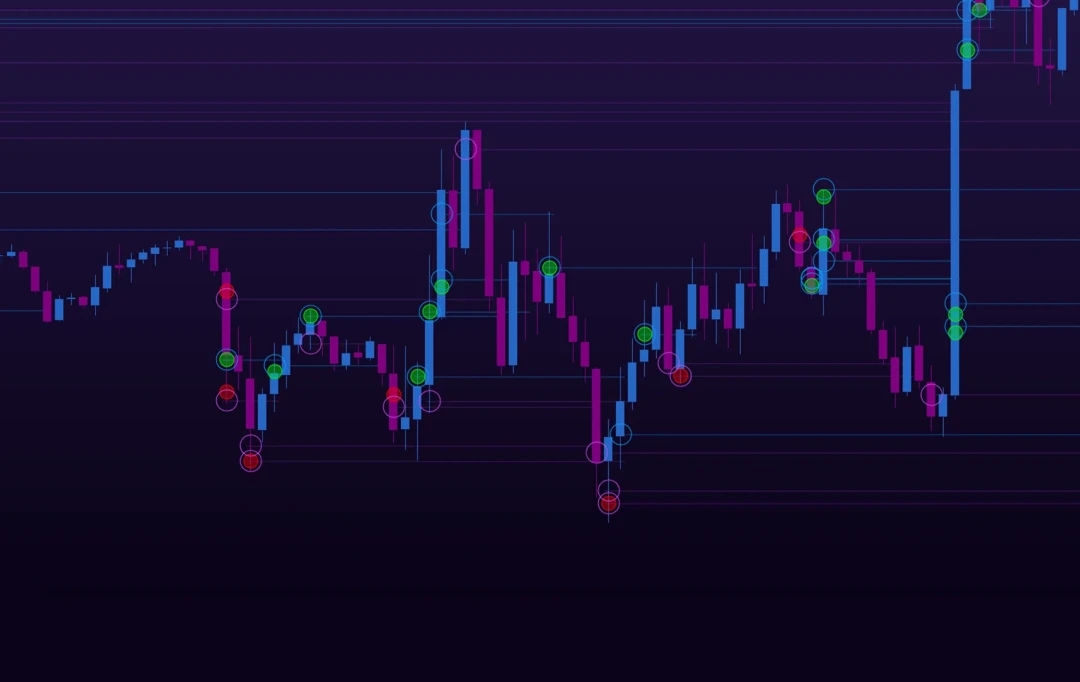
Qualified events are displayed as configurable chart markers (Ellipse, Rectangle, and other supported ATAS objects). Markers can be color-coded by trade direction, dynamically sized according to volume, and optionally display volume labels.
Stage 6 — Support and Resistance Zone Construction
When enabled, each qualifying event automatically generates a horizontal support or resistance zone.
Zone placement can be based on the Last, Start, Weighted Average, or Start-to-Last price. Zones remain active until they meet the selected invalidation criteria, including touch detection, candle body or wick crossings, three-touch validation, or bar-count expiration.
Stage 7 — Multiple Independent Profiles
Up to five independent filter profiles can run simultaneously. Each profile executes the complete analysis pipeline using its own configuration, allowing different filtering criteria, visualization styles, and support/resistance settings to be displayed on the same chart.
Settings
Flow Scanner Pro provides extensive customization through four dedicated settings panels.
Data Settings
- Input Mode: Cumulative Trades or Separated Trades
- Filter Mode: Manual (Min/Max Volume) or Auto (Soft, Medium, Hard)
- Price Location Filter: Body, Wick/Shadow, High, or Low, each supporting All, Trend Only, or Reverse Only modes
- Execution Price Reference: Last, Start, or Weighted Average
- Time Filter: Custom From/To session window
Visualization Settings
- Marker shape: Ellipse, Rectangle, or other supported ATAS drawing objects
- Fixed or dynamic marker sizing based on trade volume
- Independent transparency controls for markers and cluster highlights
- Filled or hollow marker styles
- Optional volume labels with manual or automatic display
- Custom Buy/Sell colors for markers and footprint cluster highlights
- Independent Buy/Sell zone colors
- Adjustable zone height (ticks)
- Filled or hollow support/resistance zones
- Configurable zone invalidation rules
- Bar extension count
- Historical day limit (0–7 days)
- Session reset option
- Zone price calculation: Last, Start, Weighted Average, or Start-to-Last
- Zone placement filter: All, Body, or Shadow
- Biggest Only mode (limits each candle to a single zone)
Alerts
- Enable or disable detection alerts
- Custom notification sound
- Custom alert message
- Alert background color
Additional Filter Profiles
Flow Scanner Pro supports up to five independent filter profiles within a single indicator instance.
Each profile can be:
- enabled or disabled independently;
- assigned a custom name;
- color-coded for easy identification;
- configured with its own complete set of filtering, visualization, alert, and support/resistance settings.
This allows multiple analytical approaches to run simultaneously on the same chart without requiring additional indicator instances.
Example Use Cases
Example 1 — Identifying Potential Absorption Near Support
A trader enables Body Mode with the Reverse Only setting and turns on automatic support and resistance zones.
When a large buy-side volume event occurs within the body of a bearish candle, Flow Scanner Pro highlights the event and creates a support zone. If price later revisits that area, the trader can evaluate how the market reacts using additional analytical tools before making a trading decision.
Example 2 — Analyzing Wick Rejections
With Wick Mode set to Reverse Only, the indicator highlights significant sell-side volume events occurring within the upper wicks of bullish candles.
These events may indicate strong selling activity or price rejection. The automatically generated resistance zone provides additional market context that traders can incorporate into their broader market analysis.
Example 3 — Focusing on Active Trading Sessions
A futures trader enables the Time Filter for the 09:30–10:30 New York market session.
The indicator displays only qualifying volume events detected during this period, allowing the trader to focus on one of the market's most active trading sessions while filtering out activity outside the selected time window.
Example 4 — Multi-Profile Market Analysis
The trader configures two independent filter profiles.
- Profile 1 uses the Auto / Hard filter to highlight only the largest qualifying volume events and generate long-term support and resistance zones.
- Profile 2 uses the Auto / Soft filter with a different color scheme to display smaller volume events for short-term market analysis.
Both profiles operate simultaneously on the same chart, providing multiple analytical perspectives without requiring additional indicator instances.
Example 5 — Evaluating Breakout Activity
A trader monitors resistance zones generated from previous sell-side volume events.
When price moves above one of these zones while new buy-side volume events appear within the candle body, the indicator provides additional information about current market activity. The trader can combine this information with other analytical methods as part of their overall decision-making process.
Pricing
Monthly
$29.99/month
Quarterly
$71.99 / 3 months
Save 20% compared to the monthly plan.
Start with 7 days of full access to every Flow Scanner Pro feature and evaluate the indicator in your workflow before subscribing.
SmartFlow Edge is a team of hands-on, practicing traders specializing in developing volume and order flow analysis tools for futures markets. Its proprietary indicator lineup includes Volume Profile and price delta tools, ready-made chartbooks, and custom development for ATAS and ATAS X. The subscription includes not only indicators but also educational materials, session-prep breakdowns, and access to the Discord community.
Detects limit walls on footprint charts — levels where high volume absorbed aggressive orders. Highlights absorption zones and builds support/resistance zones using imbalance ratio and candle anatomy. Compatible with ATAS Classic and X.
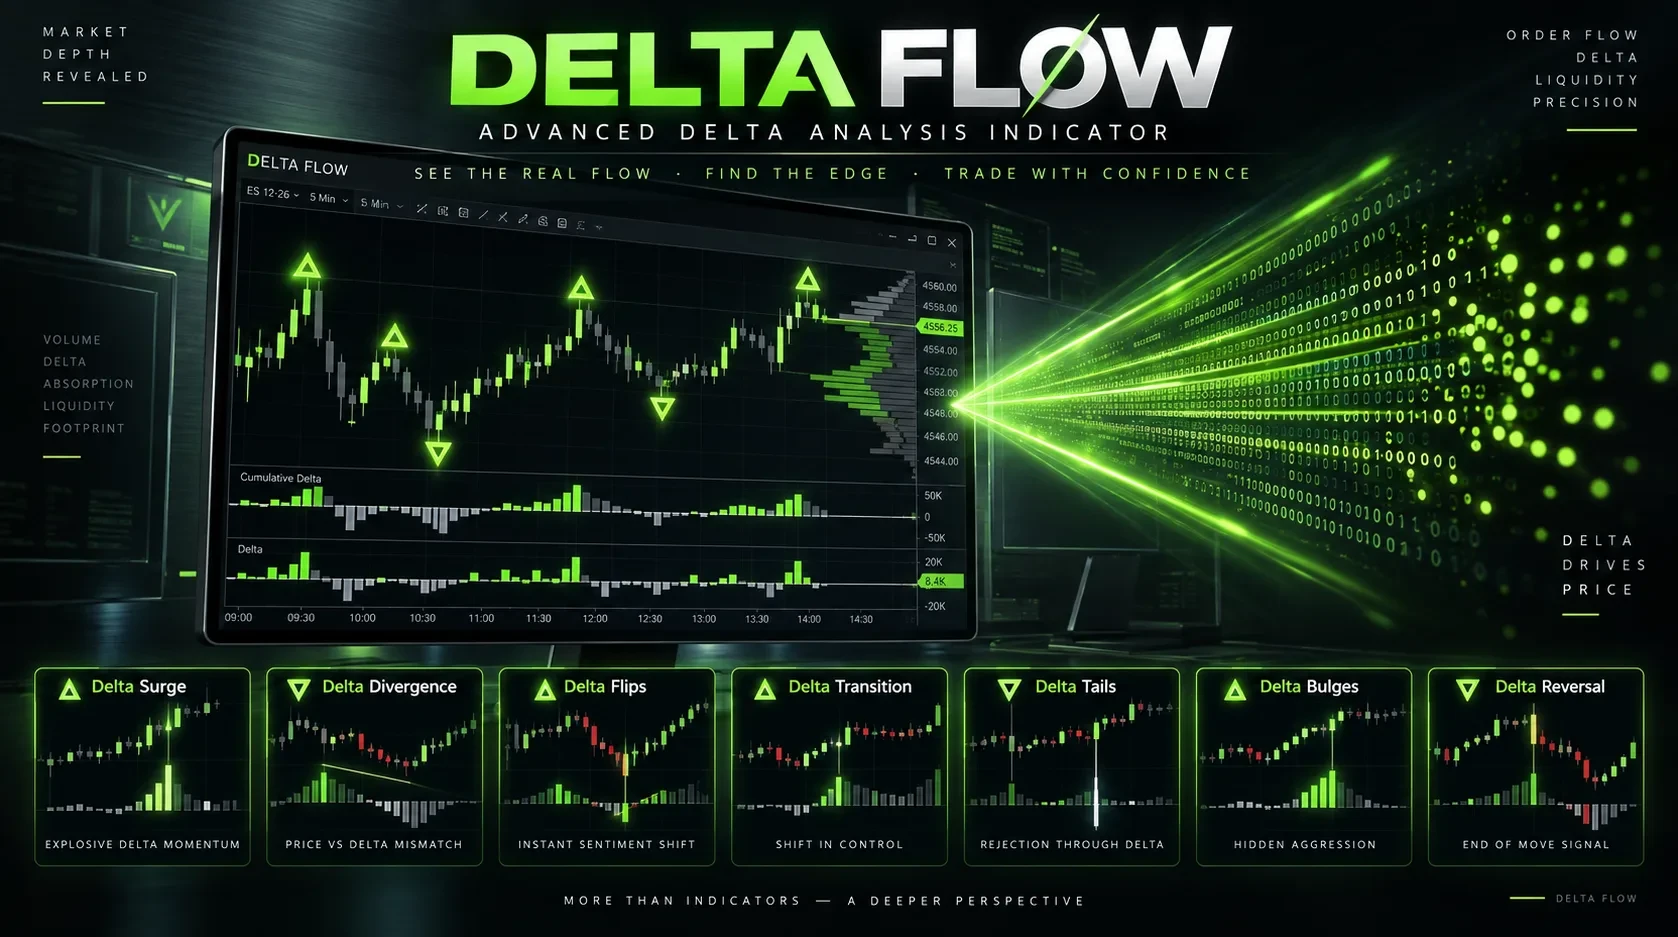
Advanced order flow indicator for ATAS: highlights seven delta-based patterns — Surge, Divergence, Flips, Transition, Tails, Bulges, and Reversal. Helps spot momentum shifts, failed breakouts, and potential reversal conditions.
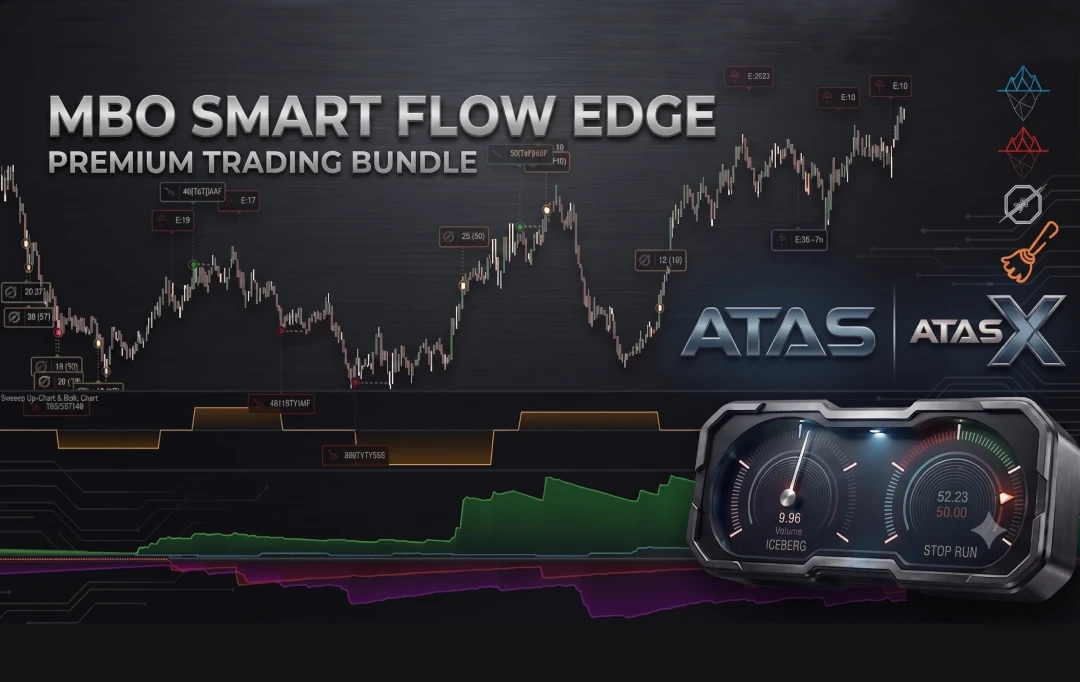
MBO Smart Flow Edge analyzes order flow using Market By Order data: it detects iceberg orders, stop-loss triggers, and aggressive market sweeps on the chart and in a separate panel. Helps you spot significant liquidity and potentially meaningful setups.
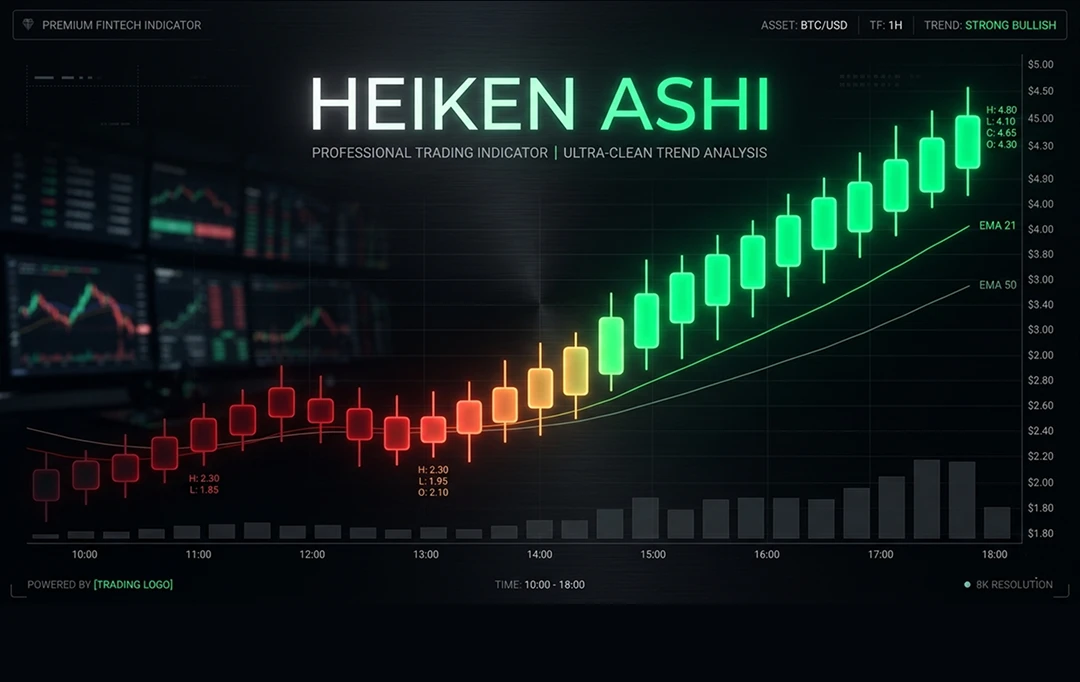
Smooths candles directly on the chart, filtering out market noise. Helps traders more easily read trend direction and potential signs of exhaustion. Compatible with ATAS Classic and X.
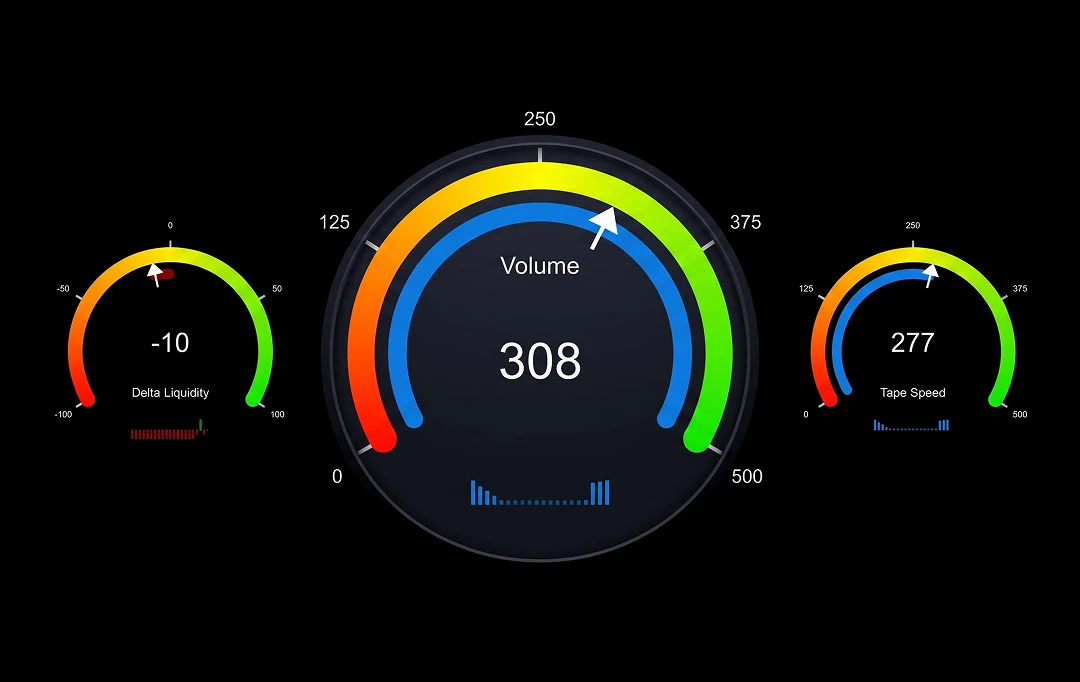
A real-time order flow dashboard: shows momentum and liquidity on the chart using needle gauges. Up to 7 metrics (Speed of Tape, Delta DOM, Delta Volume) help traders quickly read order book pressure. Compatible with ATAS Classic and X.
SmartFlow Edge turns complex quantitative and order flow strategies into indicators, algorithmic solutions, and low-latency analytical software — integrated with the ATAS Classic and ATAS X analytics platforms.
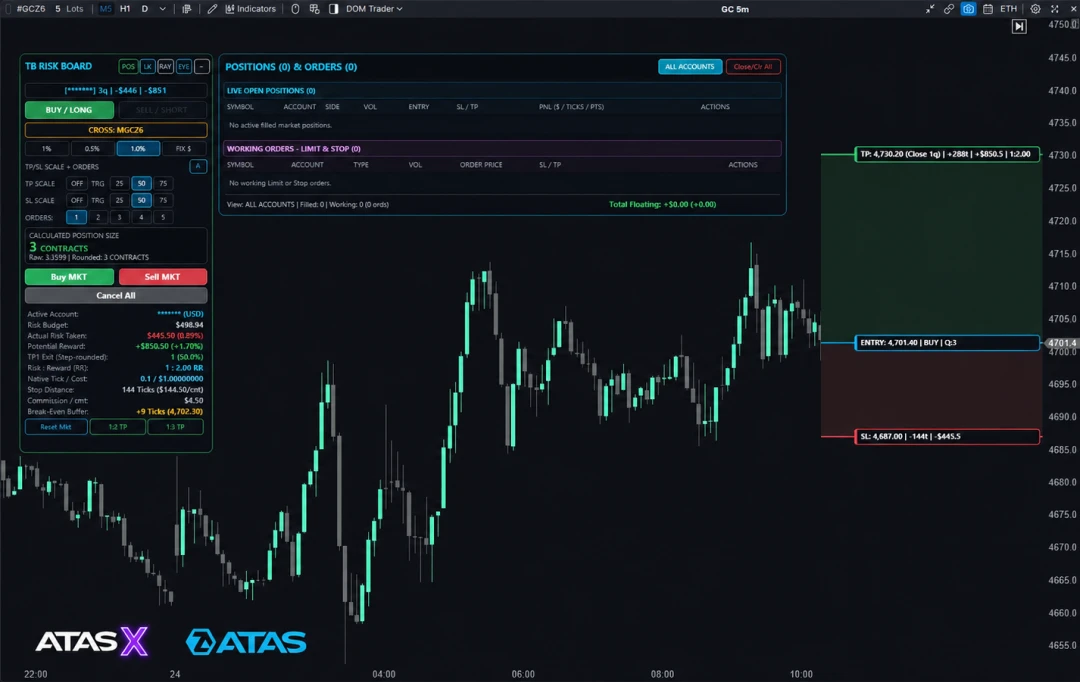
Risk panel on ATAS chart: interactive Entry, Stop Loss, and Take Profit lines calculate exact lot size, $ risk, and R:R in real time. One-click execution, automated breakeven, trailing stop, order scaling, and max risk control.