
 Publication:03.08.2026
Smart Gauges
- Category: Algotrading
- Asset class: Futures, Stocks, Cryptocurrencies
Description
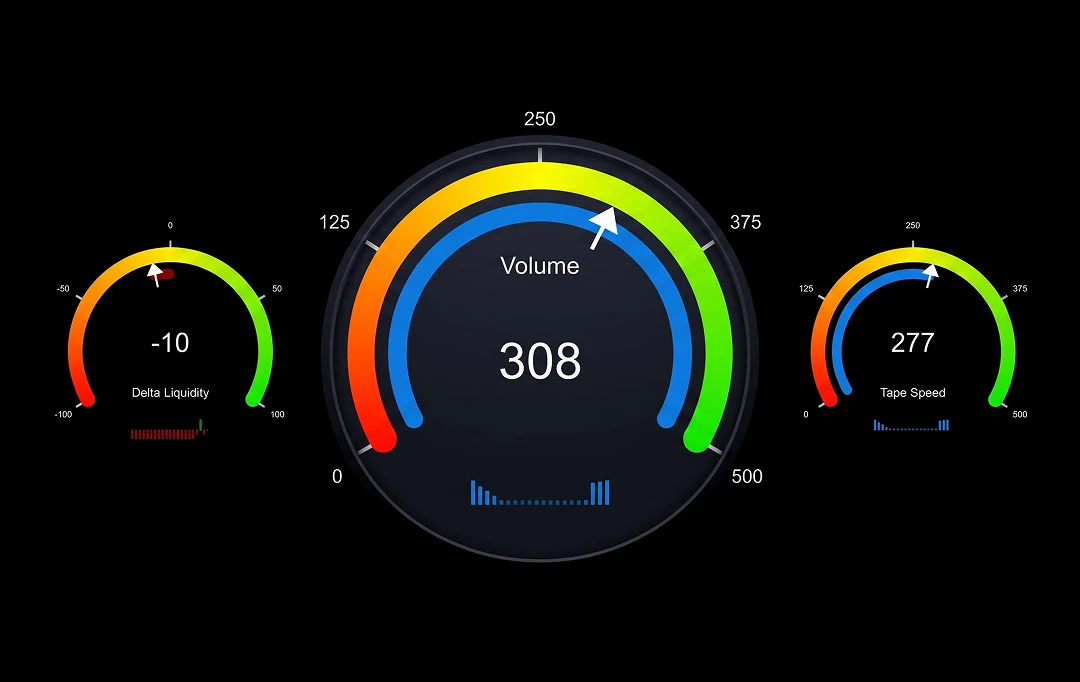
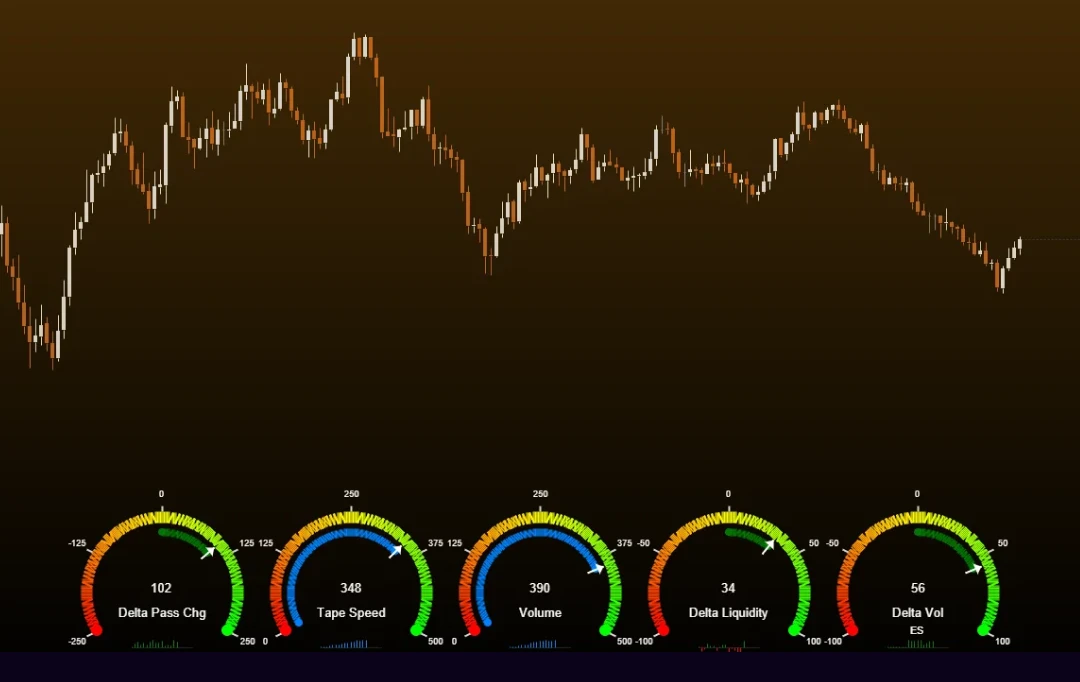
Smart Gauges is a real-time, volume-based order flow dashboard: a custom visualization indicator that displays DOM (Depth of Market) and tape execution data as animated needle gauges directly on the chart. It is not a trend-following indicator or an oscillator, but a market microstructure monitoring tool for scalpers and active traders.
Smart Gauges readings are not a standalone buy or sell signal. The indicator visualizes order flow metrics — the trader interprets them and makes decisions as part of their own analysis.
Key Features
7 independent metric types in one indicator. Each gauge can display any of the following metrics: Volume, Delta Volume, Speed of Tape, Delta Spread, Delta DOM, Delta Liquidity, Delta Passive Change — the full spectrum of order flow data.
Up to 10+1 simultaneous gauges. One main gauge plus up to 10 additional independent gauges — each with its own metric, interval, color, and alert settings, all displayed side by side in a single indicator instance.
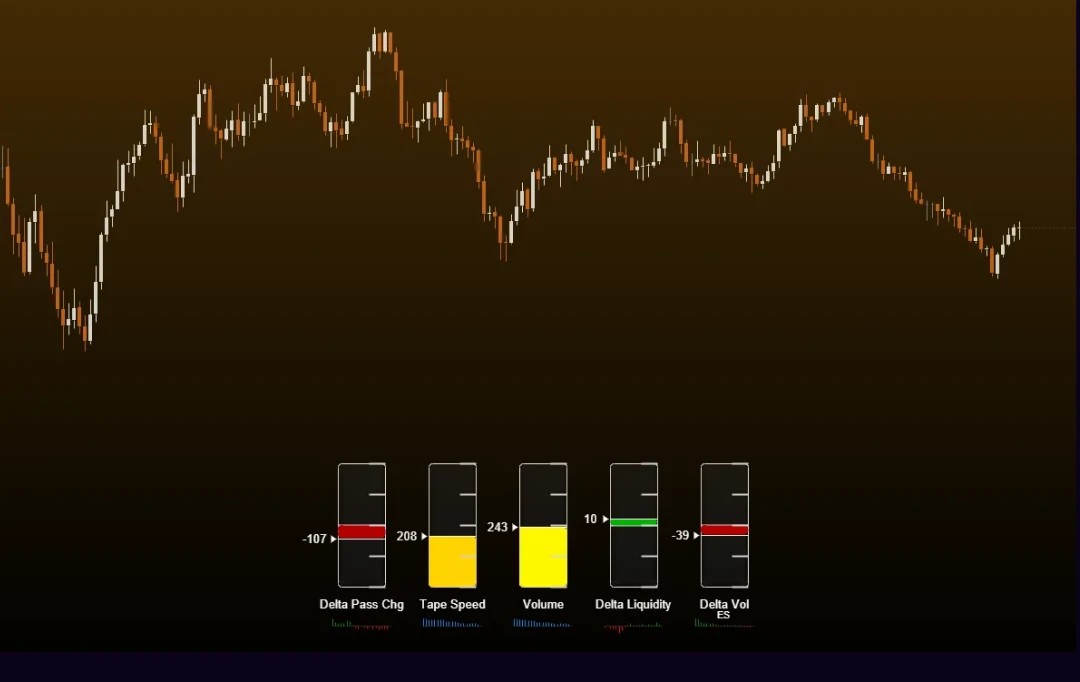
Three visual styles. Gauges render as SemiCircle (classic needle), Vertical Rectangle, or Horizontal Rectangle — chosen based on preference or screen layout.
Auto-scaling with decaying peak memory. The gauge scale automatically adjusts to current market conditions using a decaying peak algorithm — the needle stays calibrated to current volatility without manual scale adjustment.
Exponential DOM weight decay. For liquidity metrics, deeper DOM levels get an exponentially smaller weight via a configurable Fade Ratio — giving a more representative picture of real liquidity pressure near the best bid/ask.
Training period normalization. Delta Liquidity is normalized against its own observed historical maximum over a configurable window (10–1800 seconds) — always outputting a relative 0–100% reading, regardless of the instrument's absolute volume.
Per-gauge threshold alerts. Each gauge independently fires when it crosses a user-defined threshold, with a cooldown between repeated alerts and automatic direction coloring (green for positive, red for negative) on two-sided metrics.
Compatible with ATAS Classic and ATAS X. The indicator automatically detects the runtime environment at startup.
How the Indicator Processes Data
Smart Gauges ingests two real-time data streams simultaneously:
Stream 1 — Trade feed (OnNewTrade). Every executed trade is timestamped with its volume, price, and direction. A sliding time window (Interval Seconds, per gauge) selects only trades from the most recent N seconds.
Stream 2 — DOM feed (MarketDepthChanged). Every bid/ask level change is captured, the level number (distance from best bid/ask in ticks) is calculated, and the change is logged as a DOM record.
Metric calculation (every render frame):
- Volume — sum of all trade volumes in the interval;
- Delta Volume — buy volume minus sell volume in the interval;
- Speed of Tape — number of trades in the interval (execution speed);
- Delta Spread — best bid queue size minus best ask queue size;
- Delta DOM — cumulative bid DOM minus cumulative ask DOM;
- Delta Liquidity — exponentially weighted bid liquidity % minus ask liquidity %, both normalized against the historical maximum over the training period;
- Delta Passive Change — level-weighted sum of bid order book changes minus ask order book changes in the interval.
The resulting value is mapped to a 0–100% gauge reading via the auto-scaling decaying-peak algorithm and rendered as a smooth needle animation.
Settings
Data (per gauge): metric type (7 options) · Interval Seconds · DOM Levels (book depth) · Training Period (normalization window) · Fade Ratio (level decay weight)
Visualization: gauge style · layout (horizontal/vertical) · radius and thickness · scale (0.5×–2.0×) · X/Y offset · gauge spacing · font size (0 = auto) · needle, text, and scale colors
Additional gauges (up to 10): each has its own metric, interval, DOM depth, training period, visual settings, and alerts
Alerts (per gauge): enable/disable · trigger threshold · custom sound · 5-second cooldown between repeated alerts
Example Use Cases
Speed of Tape spike ahead of a possible breakout. A trader watches the Speed of Tape gauge. During consolidation, the tape is slow. Suddenly the needle jumps to 80%+ — a sharp rise in executions per second may indicate a surge of aggressive activity. The trader may consider entering in the direction of the spike as one possible option while anticipating a breakout — as part of their own analysis.
Delta Liquidity divergence. The Delta Liquidity gauge shows bid liquidity at 85% of its recent maximum, while ask liquidity is at 30%. Such an imbalance may indicate an accumulation of large buy orders. The trader may use the gauge as one directional filter for entering on a pullback, further confirming the signal with their own analysis.
Delta Passive Change for tracking order book changes. With Fade Ratio = 4, a trader watches for sudden large positive Delta Passive Change readings — which may indicate large passive buy orders appearing at the top DOM levels. The trader may factor in this pattern as one possible sign of accumulation ahead of an upward move, alongside their other analysis.
Multi-gauge dashboard. A scalper runs 4 gauges at once: Speed of Tape, Delta Volume, Delta DOM, and Delta Liquidity. When all four align in the same direction simultaneously, the trader may treat this as additional confirmation of a scenario — one filter among others for entry, not a standalone signal.
Pricing
Smart Gauges is subscription-based:
- Monthly — $19.99/month;
- Quarterly — $47.99/3 months — about 20% cheaper than paying monthly ($59.97 for the same period).
All new users get a free 7-day trial with full feature access, so you can test all 7 metric types and gauge styles on live market data before subscribing.
SmartFlow Edge is a team of hands-on, practicing traders specializing in developing volume and order flow analysis tools for futures markets. Its proprietary indicator lineup includes Volume Profile and price delta tools, ready-made chartbooks, and custom development for ATAS and ATAS X. The subscription includes not only indicators but also educational materials, session-prep breakdowns, and access to the Discord community.
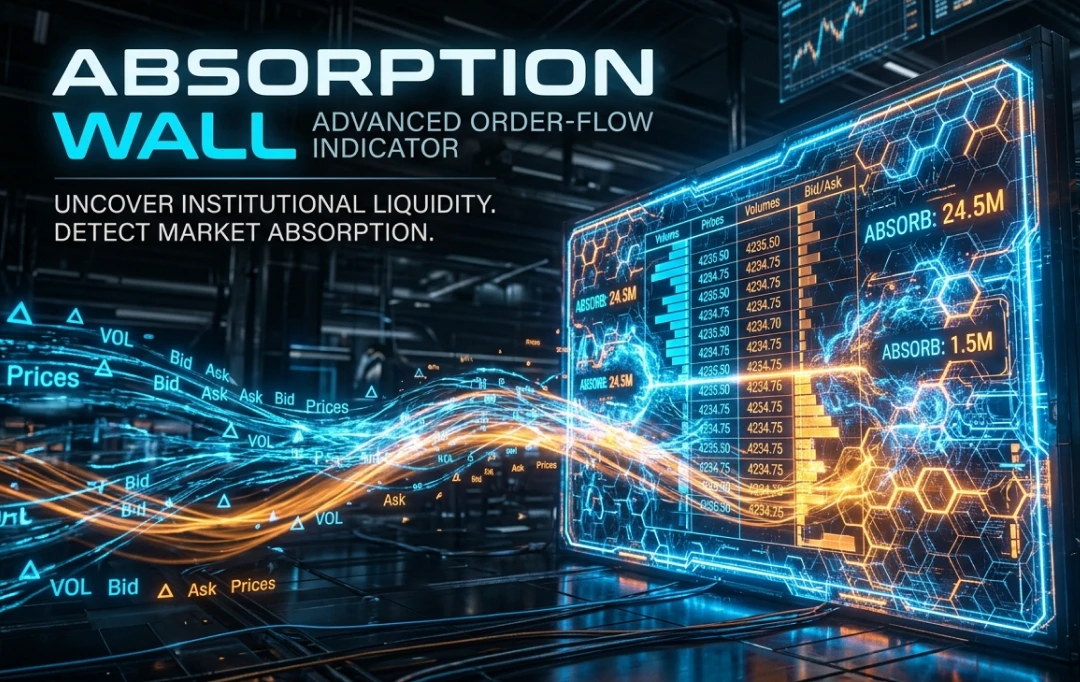
Detects limit walls on footprint charts — levels where high volume absorbed aggressive orders. Highlights absorption zones and builds support/resistance zones using imbalance ratio and candle anatomy. Compatible with ATAS Classic and X.
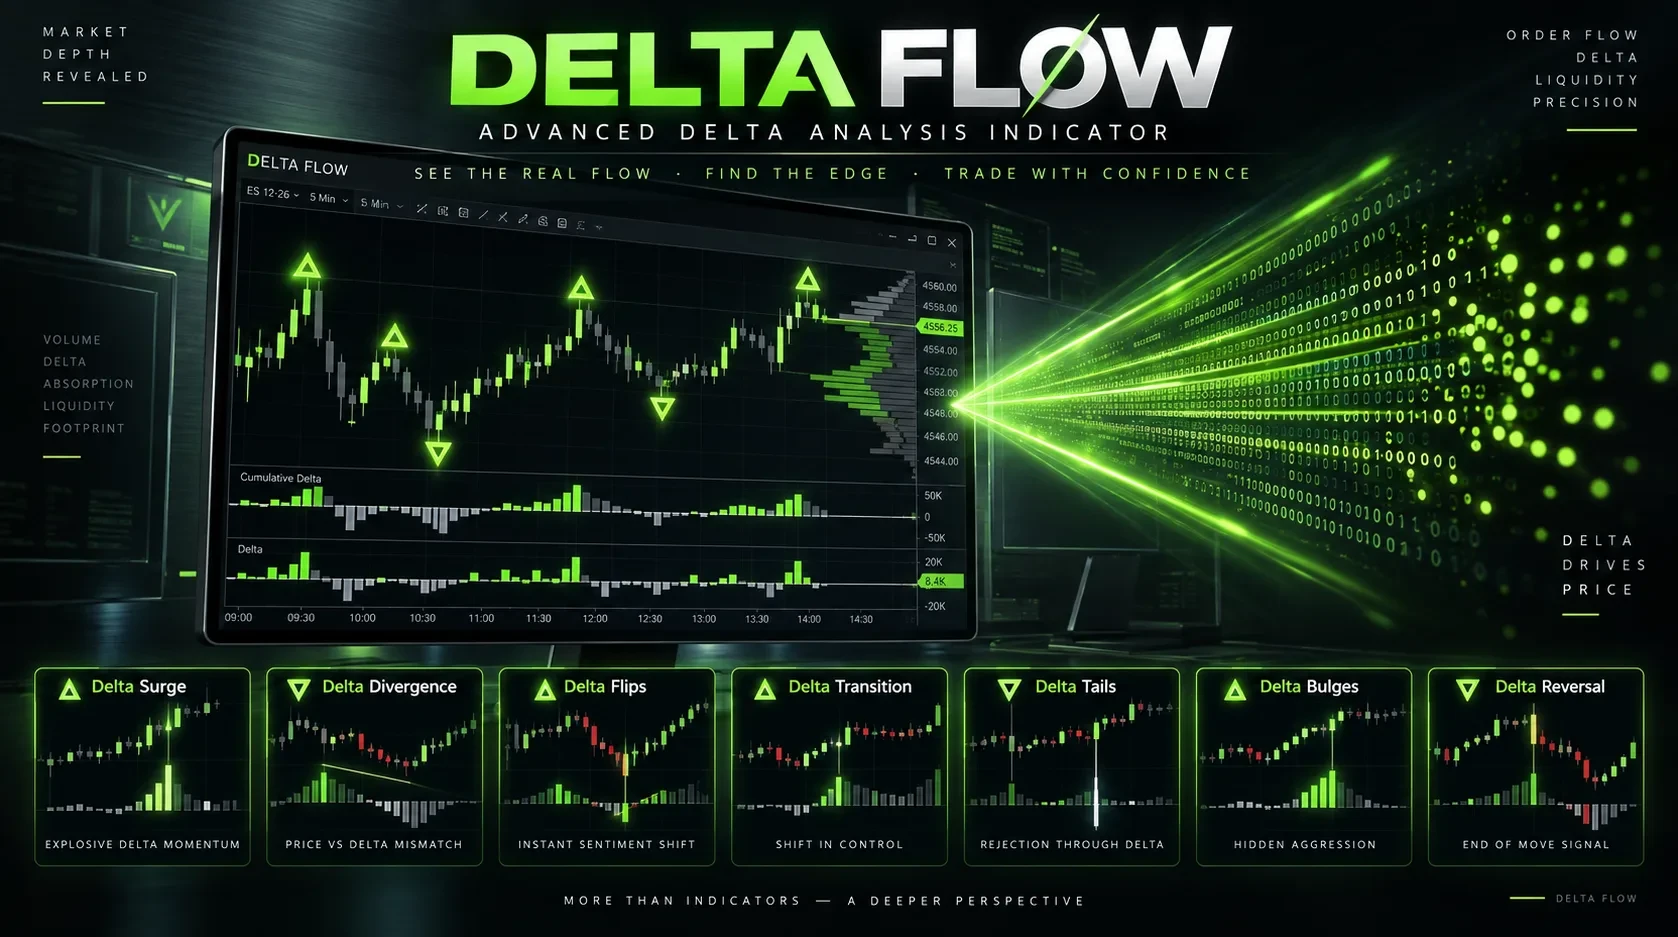
Advanced order flow indicator for ATAS: highlights seven delta-based patterns — Surge, Divergence, Flips, Transition, Tails, Bulges, and Reversal. Helps spot momentum shifts, failed breakouts, and potential reversal conditions.
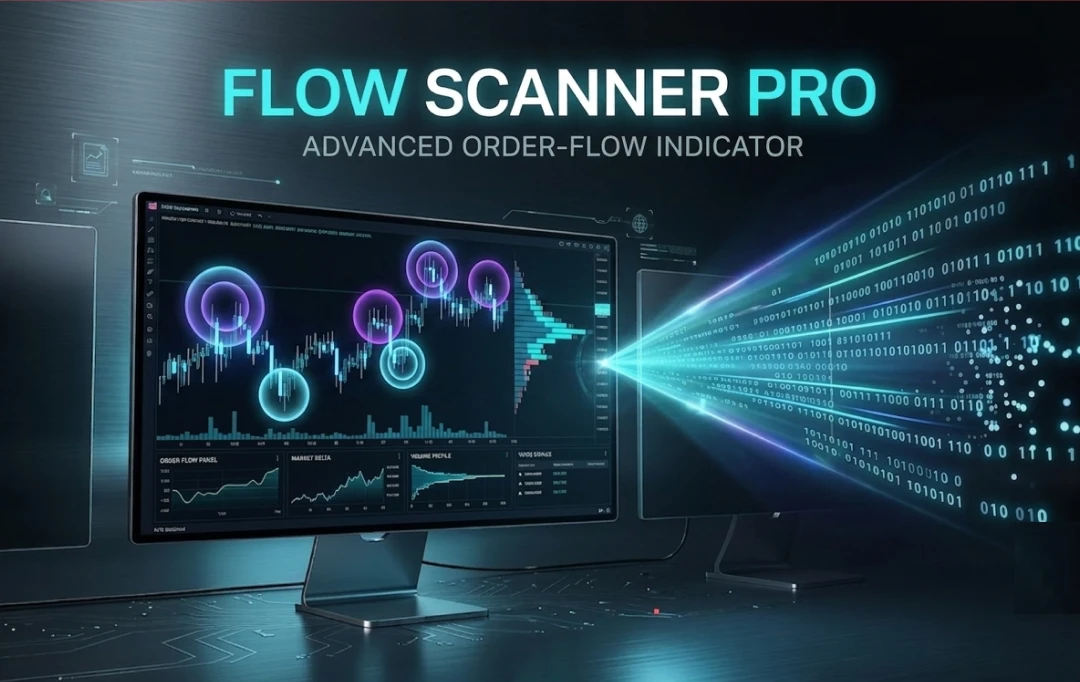
A big-trade and order flow indicator for ATAS that flags significant market orders using dynamic volume thresholds. Structural filters let traders isolate aggressive executions within specific candle zones — body, wicks, highs, lows.
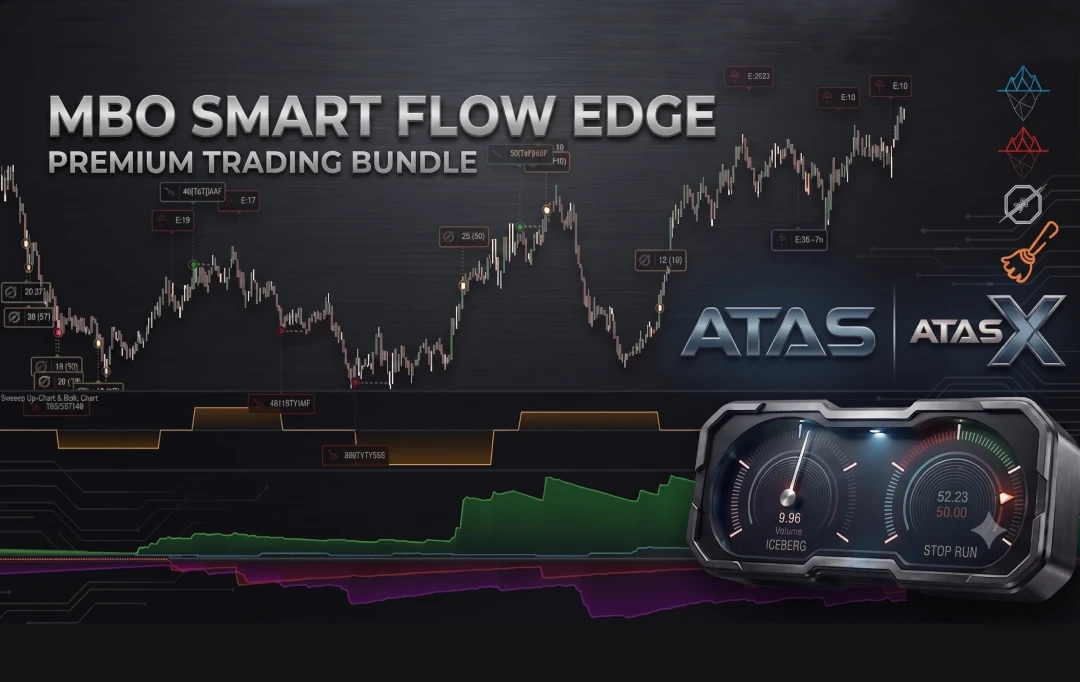
MBO Smart Flow Edge analyzes order flow using Market By Order data: it detects iceberg orders, stop-loss triggers, and aggressive market sweeps on the chart and in a separate panel. Helps you spot significant liquidity and potentially meaningful setups.
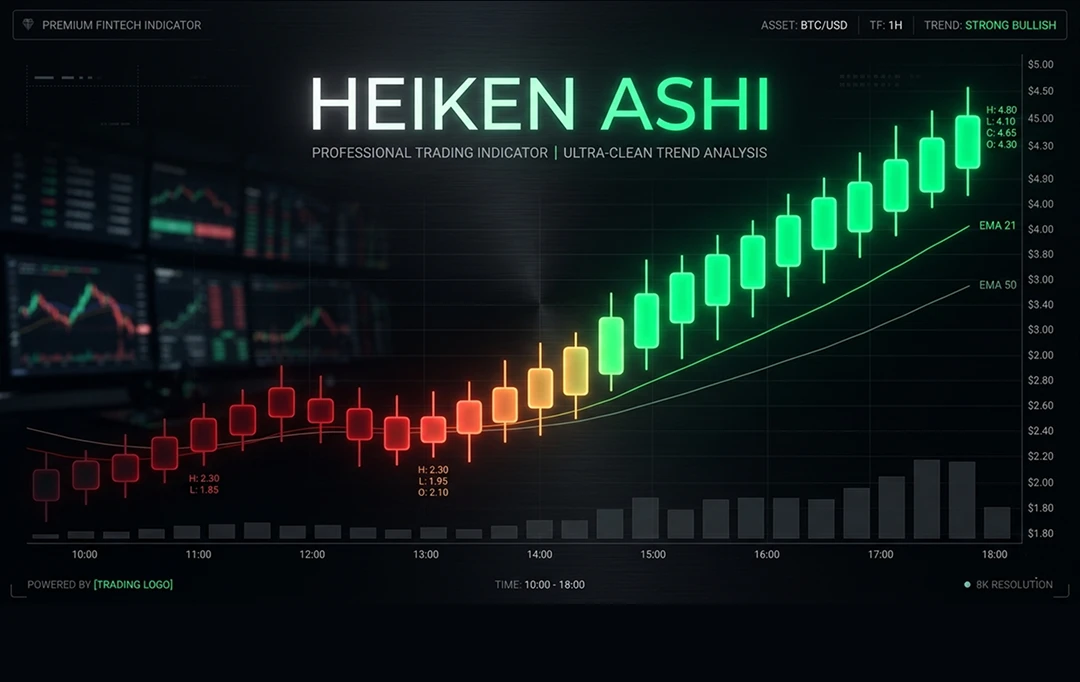
Smooths candles directly on the chart, filtering out market noise. Helps traders more easily read trend direction and potential signs of exhaustion. Compatible with ATAS Classic and X.

SmartFlow Edge turns complex quantitative and order flow strategies into indicators, algorithmic solutions, and low-latency analytical software — integrated with the ATAS Classic and ATAS X analytics platforms.
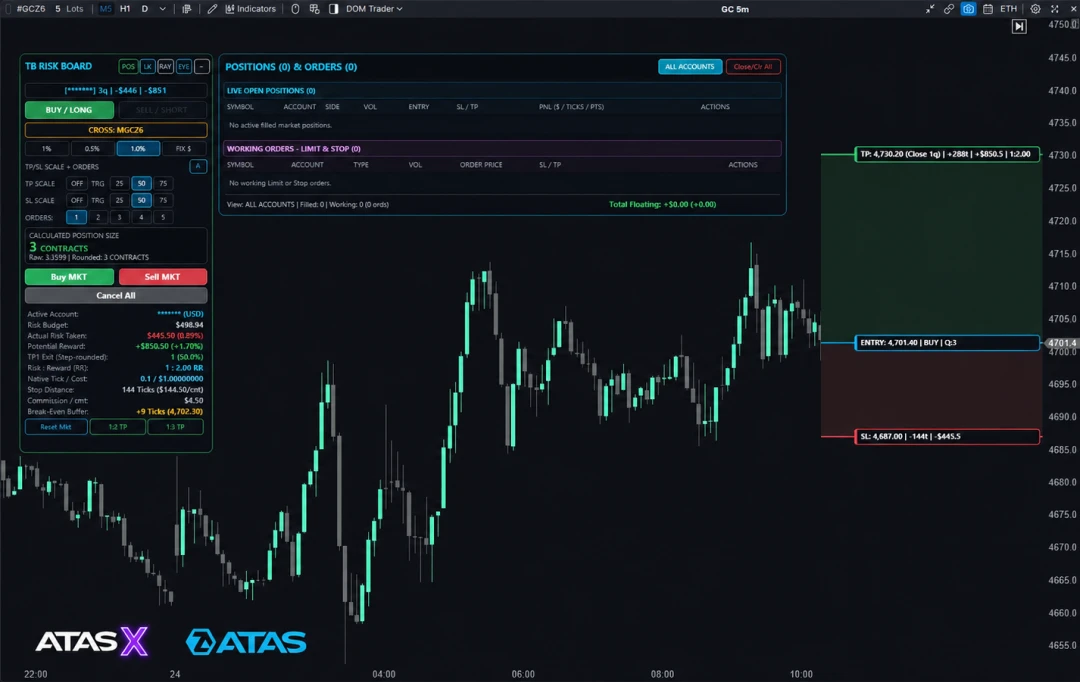
Risk panel on ATAS chart: interactive Entry, Stop Loss, and Take Profit lines calculate exact lot size, $ risk, and R:R in real time. One-click execution, automated breakeven, trailing stop, order scaling, and max risk control.