
 Publication:06.11.2026
MA Cloud
- Category: Algotrading
- Asset class: Futures, Stocks, Cryptocurrencies
Description
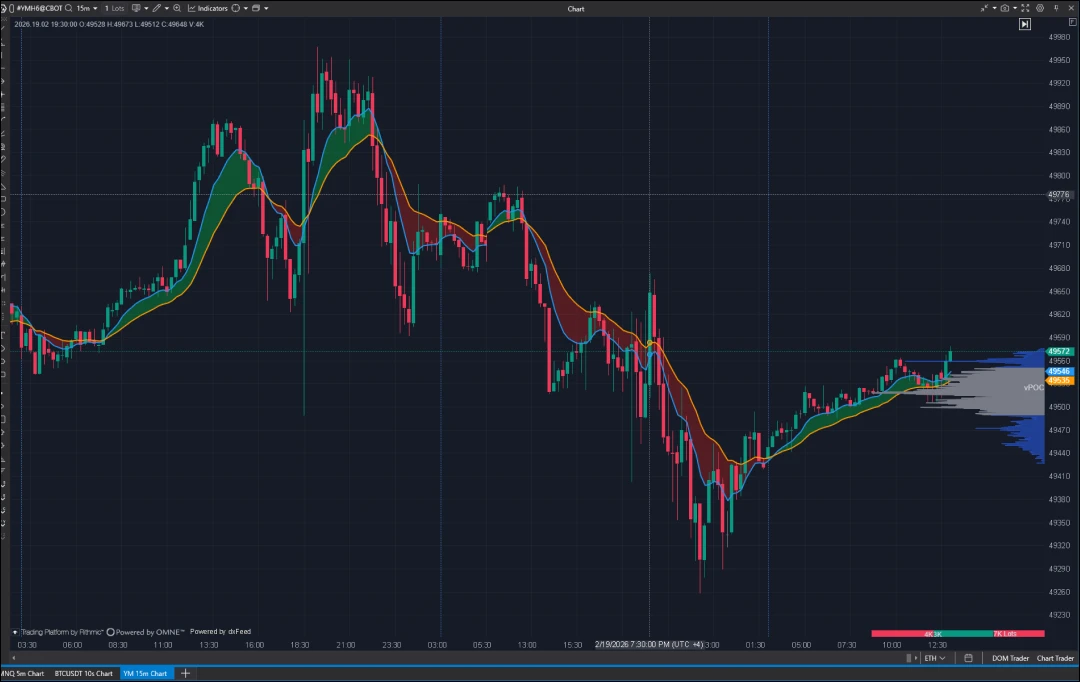
MA Cloud is a free indicator for ATAS. It draws three moving averages on the price chart and fills the areas between their pairs: MA1↔MA2, MA2↔MA3, and MA1↔MA3. The cloud is green when the first MA of the pair is above the second, and red when it is below. Color and opacity can be configured separately for each pair. MA calculations are standard, matching those built into ATAS. The indicator does not alter the underlying math and functions as a visualization layer on top of three standard moving averages.
What Problem It Solves Three moving averages on a single chart quickly turn into "spaghetti": three lines, three crossovers, and the eye loses track of which pairs are aligned in direction. MA Cloud replaces tracking crossovers with shading: the relationship of each pair can be read by color at a glance. Pairs are independent. You can enable a single MA1↔MA2 ribbon or all three to view the bigger picture. Separate colors and opacity for each pair prevent the layers from turning into a messy sludge.
Features
-
Three customizable MAs: period and type for each, with 11 types to choose from (BWMA, DEMA, EMA, SMA, SMMA, SZMA, TEMA, TMA, WMA, WWMA, ZLEMA), plus custom line color and thickness
-
Three clouds, toggled individually: from a single ribbon to the full set
-
Direction-based color: green when the first MA is above the second, red when below, with no shading during equality. Color shows the pair's direction, thickness shows the distance between the averages
-
Styling for each pair: custom colors and opacity (0–255). Default opacity is 80, keeping candles clearly visible
-
Warm-up handling: clouds are not drawn until enough bars have accumulated for the longest MA, preventing random shading at the beginning of the chart
-
Ready out of the box: defaults to EMA 10/20/50 with the MA1↔MA2 cloud enabled
-
Free, no subscription required
How the Indicator Works
-
On each bar, the indicator calculates MA1, MA2, and MA3 based on the selected types and periods.
-
Each enabled cloud is filled between the values of the two MAs on that bar, from bottom to top.
-
The fill color depends on the pair's direction: bullish if the first MA is above the second, bearish if below. No fill is applied if they are equal.
-
Disabled pairs and warm-up bars are cleared, leaving no traces of previous settings.
-
The three MA lines are drawn alongside the clouds. The MA3 line is hidden by default but can be shown in the series settings.
Clouds are drawn behind the price on the candle panel using standard ATAS range filling. No separate panel is added.
Settings Group names match the indicator settings window.
-
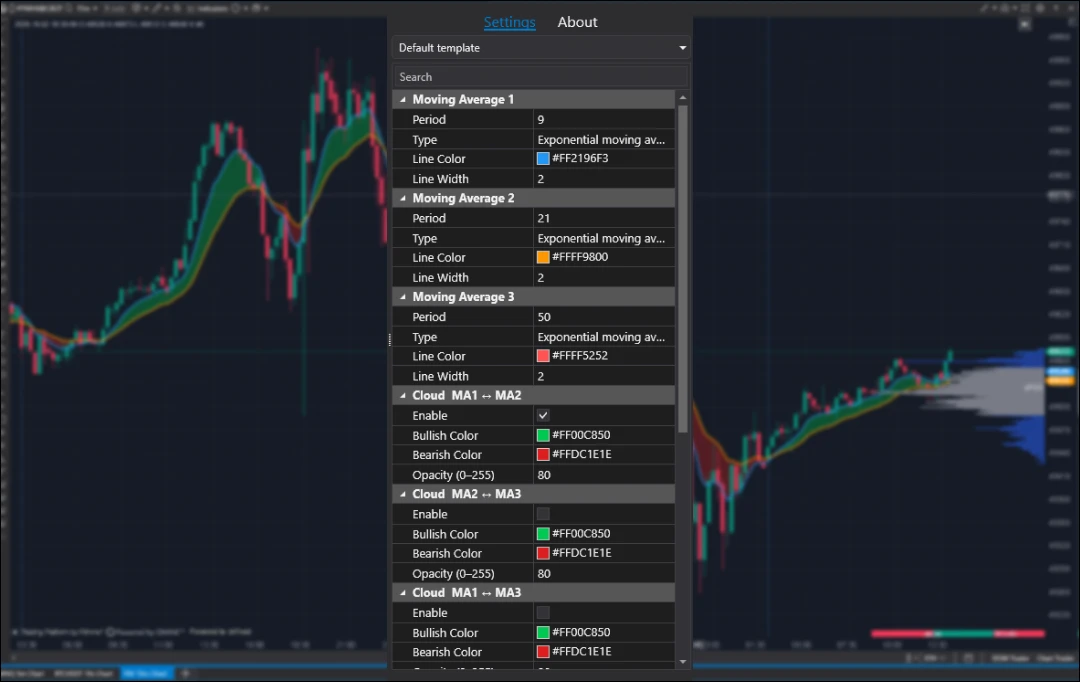
Moving Average 1 / 2 / 3: period (default 10 / 20 / 50), type (default EMA), line color (blue / orange / red), thickness (1–10). Faster MAs are best placed in lower slots so that the "bullish" color matches the position of the faster average over the slower one
-
Cloud MA1 ↔ MA2: enabled (default true), bullish and bearish colors, opacity (default 80, range 0–255)
-
Cloud MA2 ↔ MA3: same as above, default disabled
-
Cloud MA1 ↔ MA3: same as above, default disabled
Use Cases
-
Single Ribbon. Only the MA1↔MA2 cloud is enabled: green fill while the fast MA is above the slow, red while below. Direction is instantly visible without tracking crossovers
-
Three-Pair Confluence. All three clouds are enabled. If all are green, all pairs point upward. If colors differ, you can see which pairs have already changed direction, helping evaluate pullbacks in the context of the overall picture
-
Cloud Thickness. A thick MA1↔MA3 cloud means the averages are far apart. Cloud narrowing shows they are converging even before a color change occurs
-
Color Change. The transition from red to green and vice versa coincides precisely with the crossover of the pair's two MAs. Enabling multiple pairs displays all crossovers on a single chart
-
Different Average Types. The type is set independently for each slot, allowing you to build a cloud between ZLEMA 10 and SMA 50, for example
The indicator visualizes moving average relationships. This is not a trading system or financial recommendation: the trader interprets the data as part of their own personal analysis.
An independent trader and developer building custom indicators for ATAS. Development focuses on practical intraday tools that automate chart preparation and highlight session structure, with an emphasis on clean visual design and full configurability.
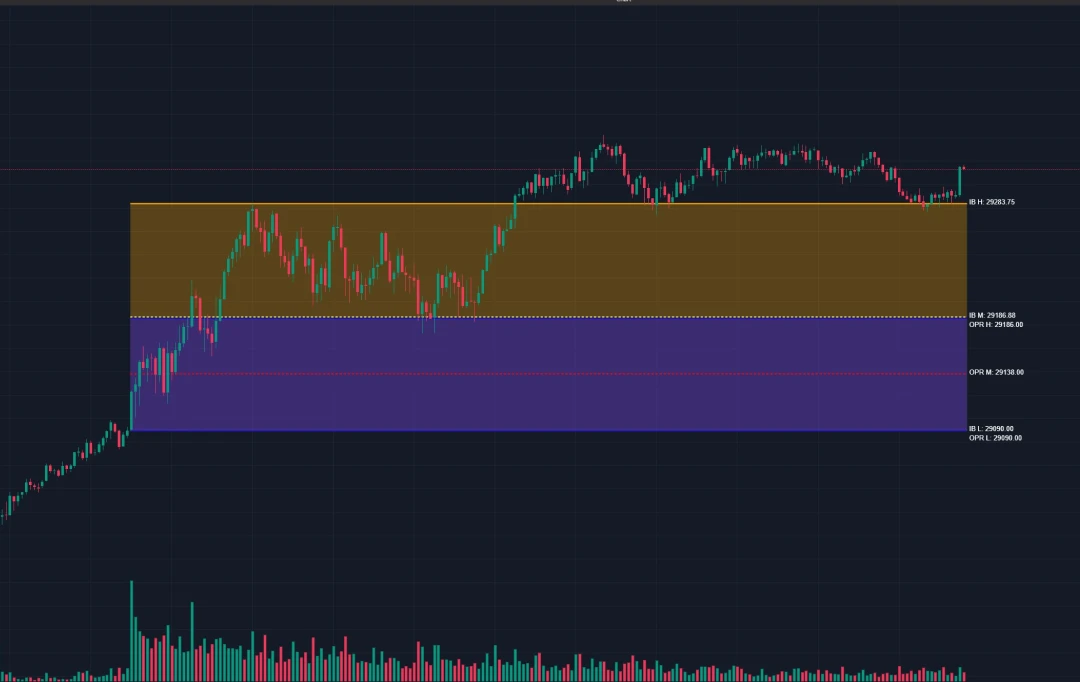
Enhanced OPR + IB — a free ATAS indicator: tracks and visualizes the Opening Price Range and Initial Balance across configurable sessions (US, Eurex, Asia, or Custom) — high/low/mid lines, extension levels, and filled zones on the chart.
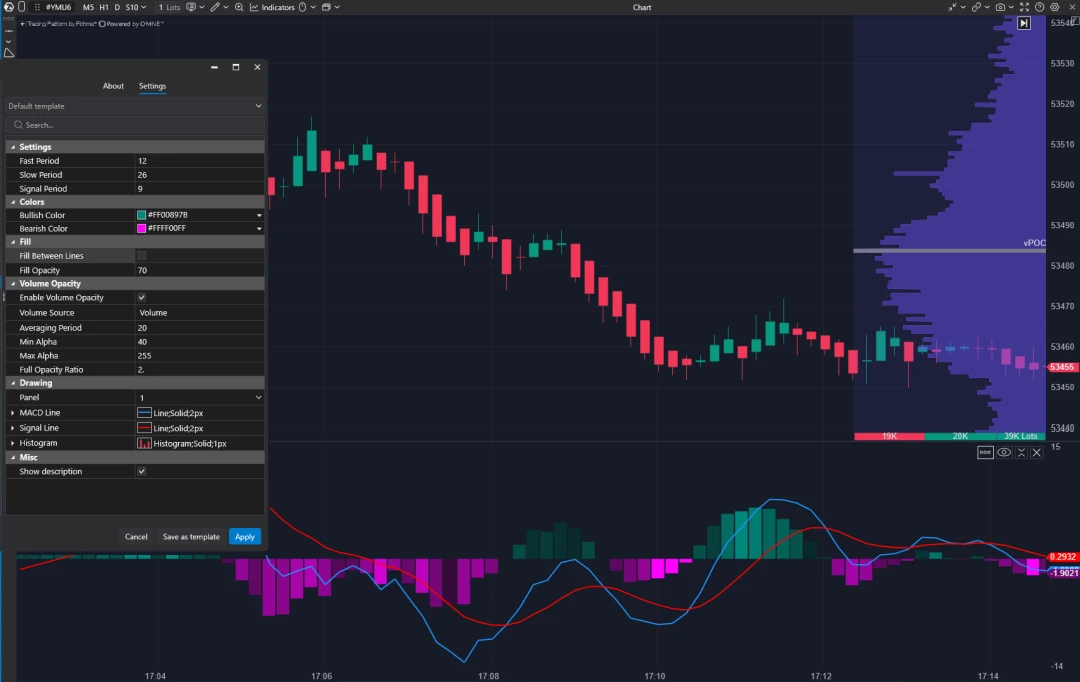
A free ATAS oscillator: plots a Zero-Lag MACD line, a standard EMA signal, and a sign-colored histogram in a separate panel. Bar opacity can be tied to volume, and the gap between MACD and Signal can be filled with separate colors.