
 Publication:30.07.2026
TMS-OCI
- Category: Algotrading
- Asset class: Futures, Cryptocurrencies
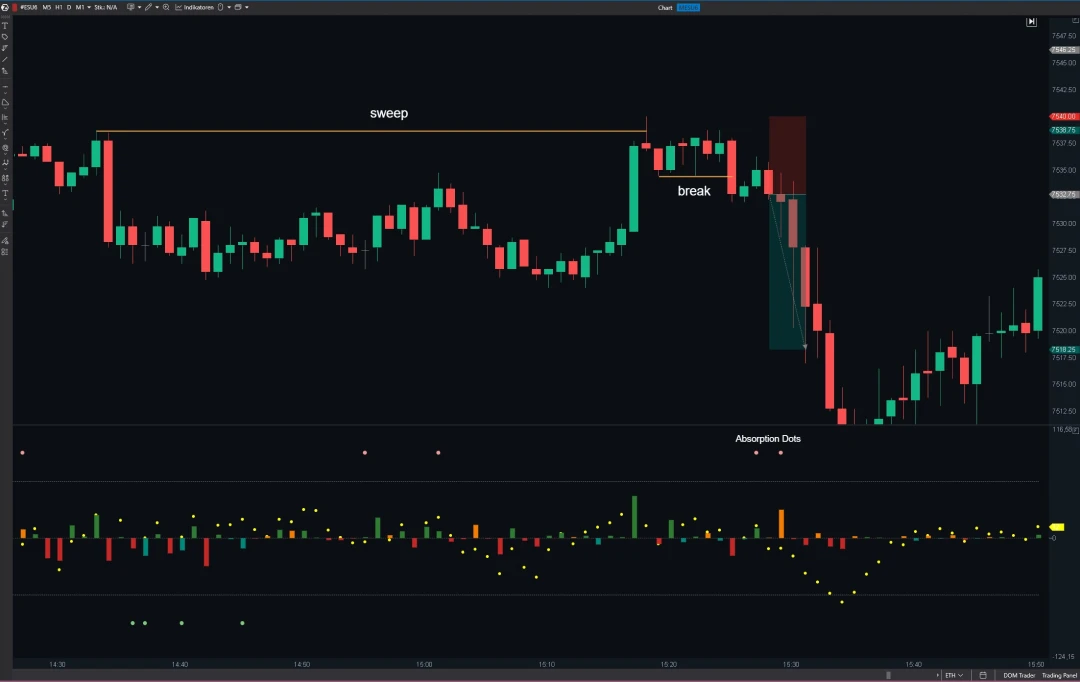
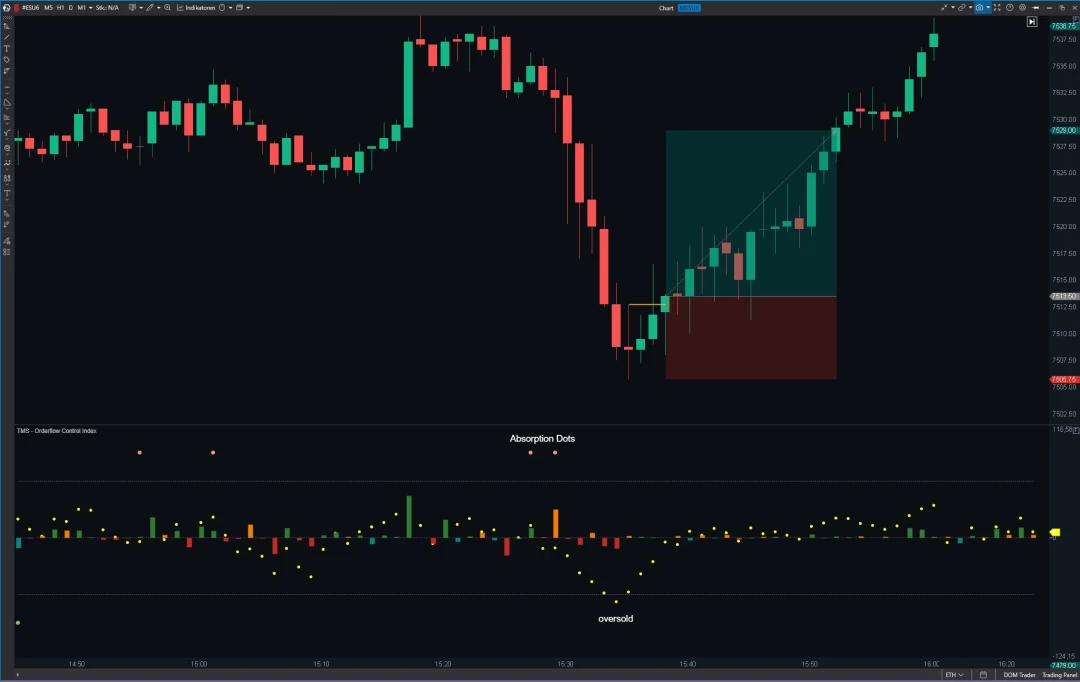
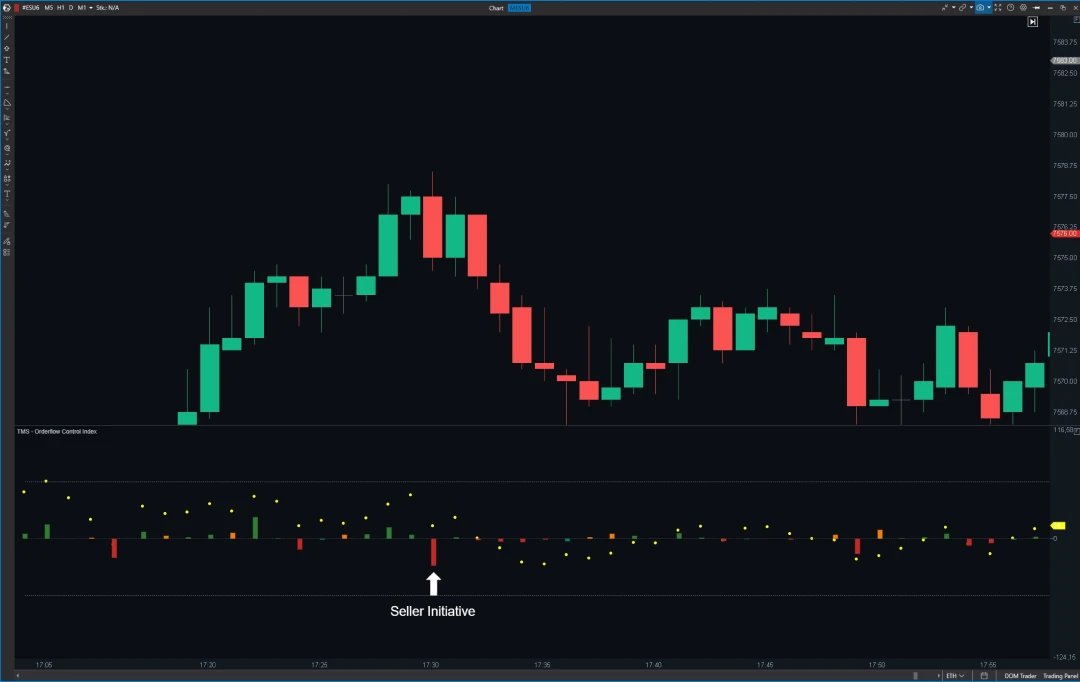
Description
TMS-OCI links aggressive order flow with the actual price reaction. The indicator checks not only which side — buyers or sellers — was more active, but whether that activity was actually able to move the market efficiently.
TMS-OCI is an order flow indicator that visualizes the current control of buyers and sellers in the market. For each candle, the indicator analyzes several order flow and price factors: delta, volume, candle direction, close position within the candle, relative volume strength, and absorption behavior.
Control Index
The core element of the indicator is the Control Index. It oscillates between positive and negative values: values above the zero line indicate stronger buyer control, values below indicate stronger seller control. The further the Control Index moves from the zero line, the stronger the current market control in that direction.
Buyer Initiative and Seller Initiative
The indicator also displays Buyer Initiative and Seller Initiative as a histogram. Buyer Initiative forms when aggressive buying volume actually results in upward price movement. Seller Initiative forms when aggressive selling volume results in downward price movement.
Absorption Flow
Another component is Absorption Flow analysis. It shows situations where aggressive buying or selling pressure is absorbed by the market without a corresponding continuation of price movement. This can point to possible exhaustion zones, reversal areas, or key defense zones — the trader evaluates these independently as part of their overall analysis.
The indicator does not serve as a standalone buy or sell signal — it is used as a supporting tool for interpreting current order flow, market control, and potential turning points.
Settings
Users can adjust various TMS-OCI parameters to fit different markets, timeframes, and trading styles:
- Control Index calculation period;
- volume averaging period;
- Control Index sensitivity;
- Absorption Impact strength — the indicator can be made more reactive or smoother;
- threshold values for weak, medium, and strong absorption (relative volume values, delta ratio values, candle position conditions) — the user decides when absorption is considered relevant;
- Flow Efficiency components — Buyer Initiative, Seller Initiative, Buy Absorption Flow, and Sell Absorption Flow — customizable to individual analysis.
Colors and displays of lines, histograms, and markers are adjusted through standard ATAS display settings and can be saved as a template.
Use Cases
Trend confirmation. If the Control Index is above the zero line and also shows Buyer Initiative, this can point to active buyer control. If the Control Index is below the zero line and shows Seller Initiative, this can point to active seller control.
Reversal zone analysis. If the market reaches a new high or low while Absorption Flow or absorption signals appear, this can suggest that aggressive pressure is being absorbed by the market and the move is losing strength.
Combining with other tools. TMS-OCI can be used together with support/resistance zones, VWAP, Opening Range, market structure, or price action — making it suitable for scalping approaches as well as intraday trading and analysis of key order flow areas.
An educational project focused on futures and prop-firm trading. No promises of quick profit — just real situations on Nasdaq and S&P 500 in live-session format, price action, market structure, and order flow. Beyond educational content, Einfach Traden offers its own indicators for analyzing volume, price, and order flow in ATAS.
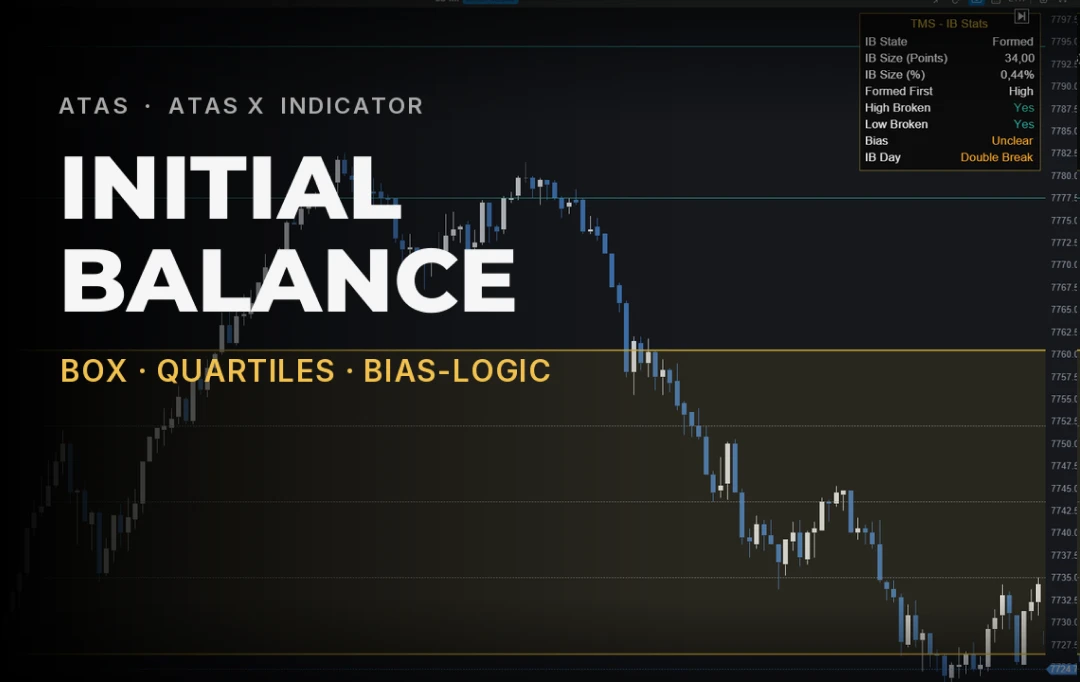
Plots Initial Balance with high/low, quartiles (25/50/75%), and extension levels. Features a stat table with breakout behavior, IB Day types, and directional bias (Long/Short/Unclear) for personal analysis. Built for 1m–15m charts.
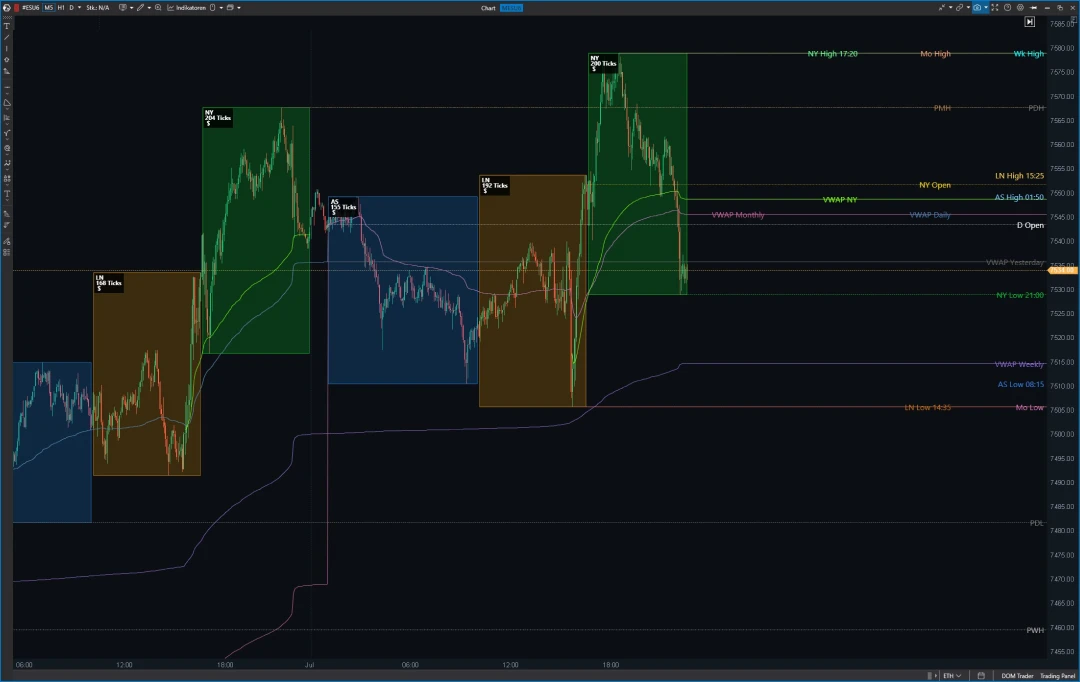
Shows session ranges, Key Levels, and various VWAP levels directly on the chart. All in one tool, fully configurable to the trader's own analysis style.
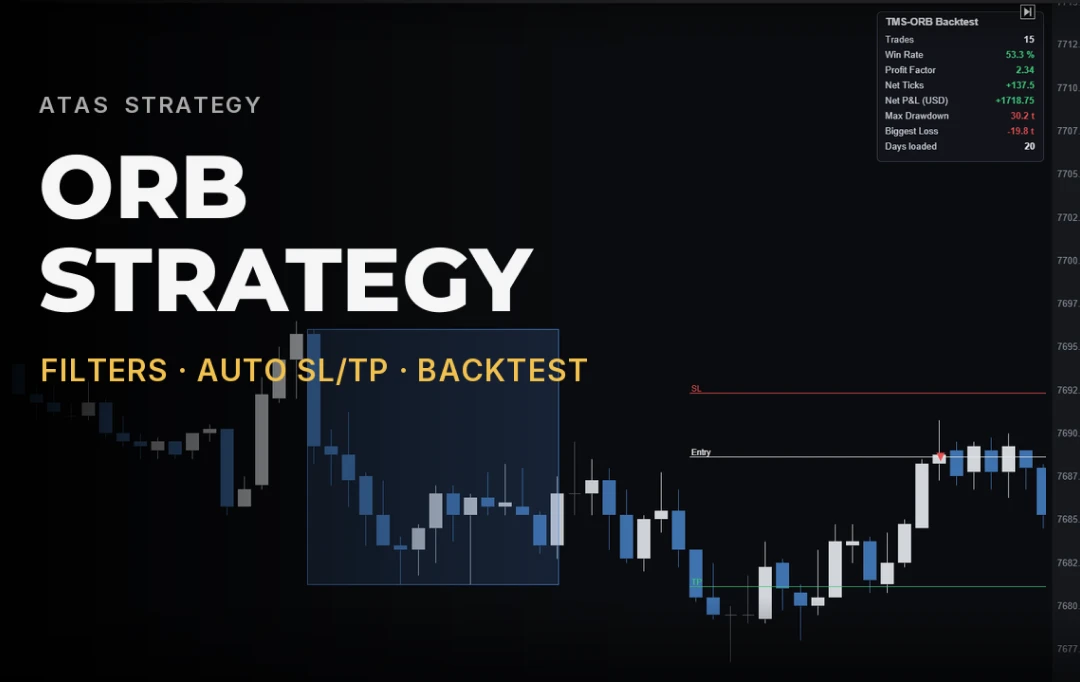
Plots Opening Range as a box with up to 8 extension targets (4 up, 4 down). Stat panel: status, ORH/ORL, and range size in points, ticks, and %. Pure visual overlay — no automated execution or risk management. Built for 1m–15m charts.
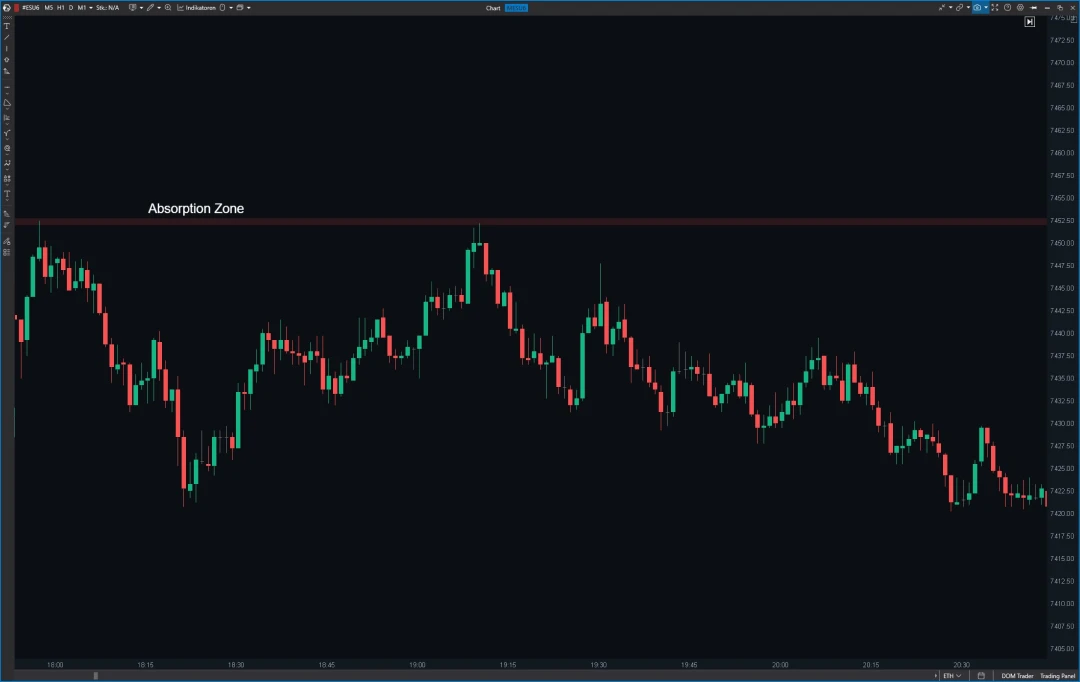
Highlights zones on the chart where price has repeatedly reacted before — ready-made support and resistance reference points, no manual line-drawing required. Not a buy/sell signal, just clean market structure for the trader's own analysis.
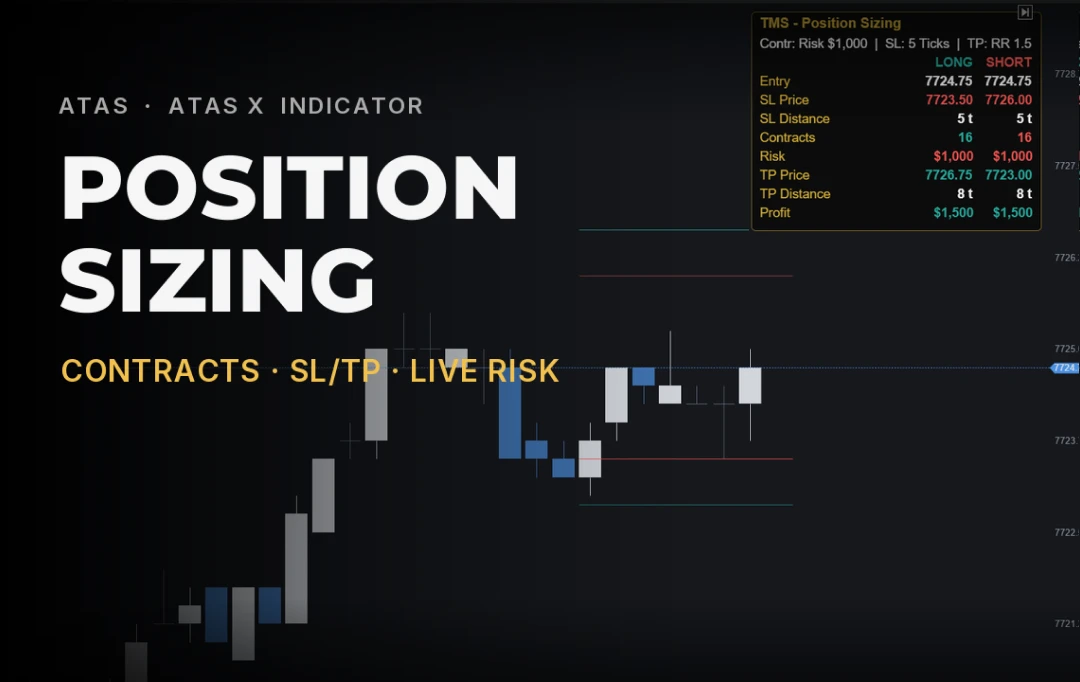
Calculates real-time, tick-exact contract sizes, SL/TP prices, risk, and reward simultaneously for LONG and SHORT. Updates continuously per candle without executing trades. Built for ATAS and ATAS X.
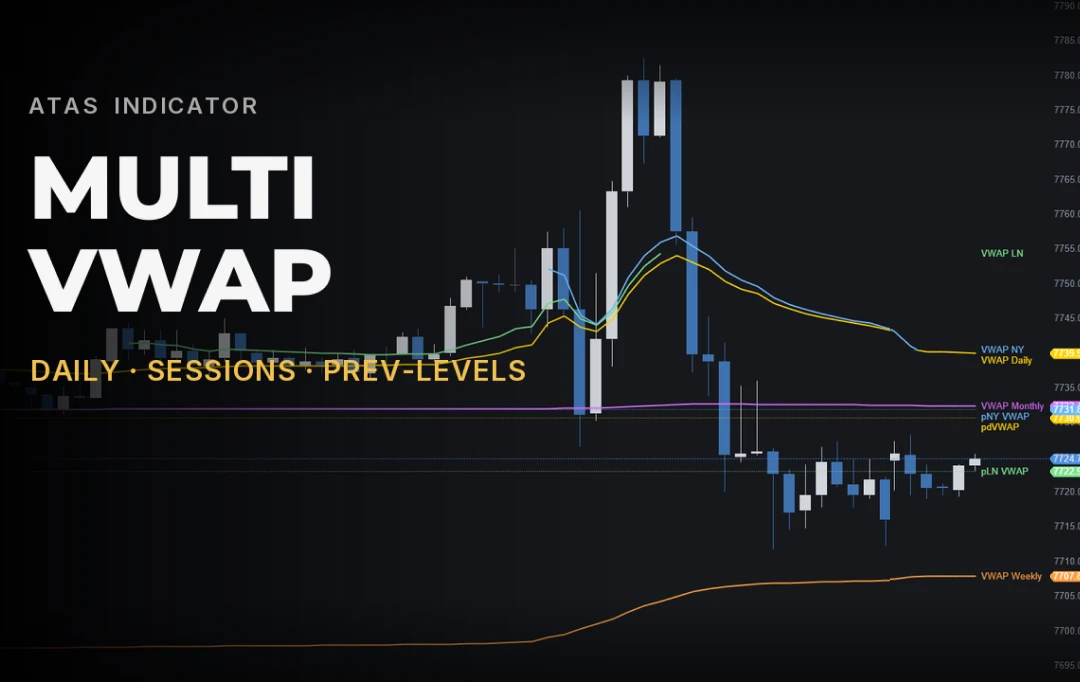
Displays up to 5 custom VWAPs simultaneously (Daily, Weekly, Monthly, London, New York) with individual toggles and color settings. Historical period lines freeze final VWAP levels as support/resistance zones. For ATAS and ATAS X.
TMS-IBS automates Initial Balance breakout trading: measures open range, triggers clean breakouts with pullbacks, and manages entries, SL, TP, and timing. The built-in backtest panel displays performance metrics directly on your chart. For ATAS.
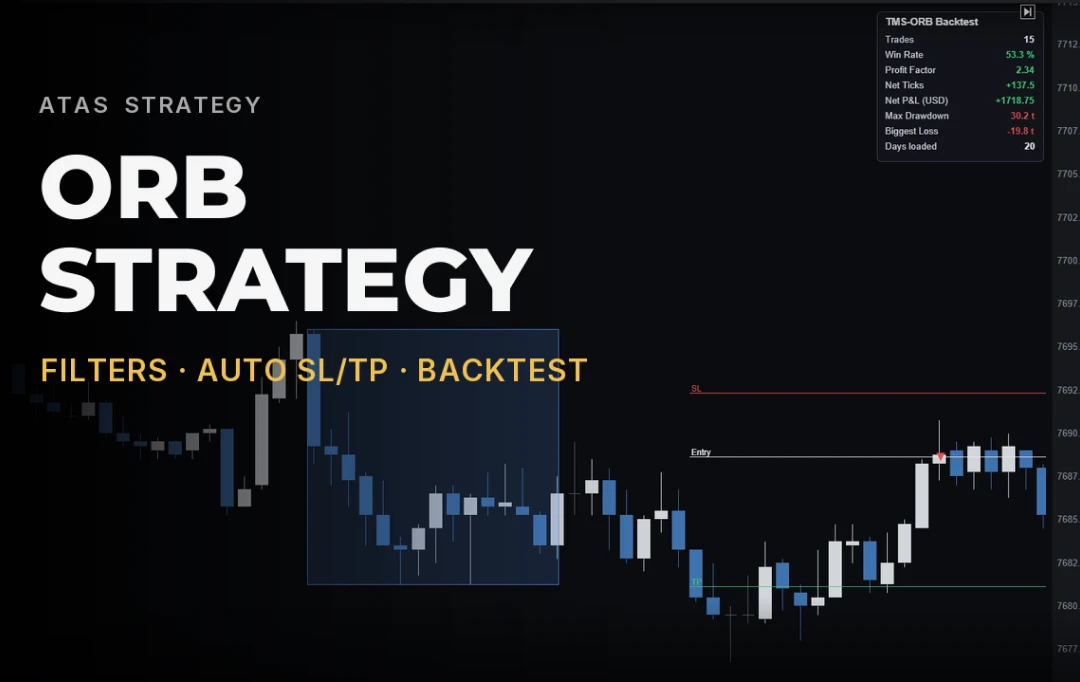
Automates Opening Range breakouts via 3 entry modes with SL, TP, and position sizing. Features daily risk filters and an on-chart backtest panel displaying performance metrics. Designed for ATAS.

In this masterclass you'll learn to read footprint elements, linking them to auction theory and market fundamentals. 8 practical strategies, live examples, and practice material — about 10 hours of video on entries and stops.