
 Publication:18.09.2026
TMS-ORB Levels
- Category: Algotrading
- Asset class: Futures
Description
The indicator provides structural level projection based on early-session volatility. It is neither a trend-following indicator nor an oscillator, but a visual overlay tool designed to project potential intraday price targets using the height of the Opening Range.
Key Features
-
Automated Opening Range Visualization: Marks the Opening Range High (ORH) and Low (ORL) with a customizable box.
-
Up to 8 Range Extensions: Projects up to 4 upper and 4 lower extension levels calculated as direct multiples of the initial range ($R = \text{ORH} - \text{ORL}$). Each level features independent toggles, color controls, and decimal multiplier settings (e.g., 0.5x, 1.0x, 2.0x, 4.0x).
-
Integrated Statistical Panel: Displays current session state (Idle, Collecting, Range fixed, No range today), ORH/ORL price bounds, and total range height measured in points, ticks, and percentage.
-
No Signal Overlays: Pure visualization tool containing no execution algorithms, buy/sell signals, or risk management filters.
-
Flexible Timezone Alignment: Manual UTC offset configuration to adapt to global market sessions.
How It Works
-
Data Collection Phase: During the designated start/end window, the indicator tracks session extreme highs and lows under the Collecting status.
-
Range Fixation & Target Calculation: Once the time window closes, the range freezes (Range fixed status). The indicator calculates range height $R$ and projects symmetric extension levels:
$$\text{Target}_{\text{Upper}} = \text{ORH} + (k \cdot R)$$$$\text{Target}_{\text{Lower}} = \text{ORL} - (k \cdot R)$$ -
Session Reset: Calculations execute once per session and reset automatically at the start of each new trading day.
Settings
-
Range Definition: Start/end time window and UTC offset.
-
Upper & Lower Extension Levels: 4 upper + 4 lower levels with individual toggles, multiplier inputs, and color selectors.
-
Range Box Styling: Fill color, opacity, and border settings.
-
Level Lines & Labels: Line thickness, style (solid/dashed/dotted), and label text size.
-
Historical Data: Number of historical days to retain on the chart.
-
Statistical Panel: Display position, background colors, font size, and visibility toggle.
Use Cases
-
Volatility Check: Day traders evaluate the initial range width against recent sessions to adjust target expectations early in the day.
-
Breakout Extension Targets: On a clean breach above ORH, traders reference the 1.0x and 2.0x upper extensions as objective partial-profit targets for continuation setups.
-
Extreme Trend Days: Order flow traders align internal execution triggers (volume absorption, order book imbalance) with 3.0x or 4.0x extension targets during high-momentum session trends.
An educational project focused on futures and prop-firm trading. No promises of quick profit — just real situations on Nasdaq and S&P 500 in live-session format, price action, market structure, and order flow. Beyond educational content, Einfach Traden offers its own indicators for analyzing volume, price, and order flow in ATAS.
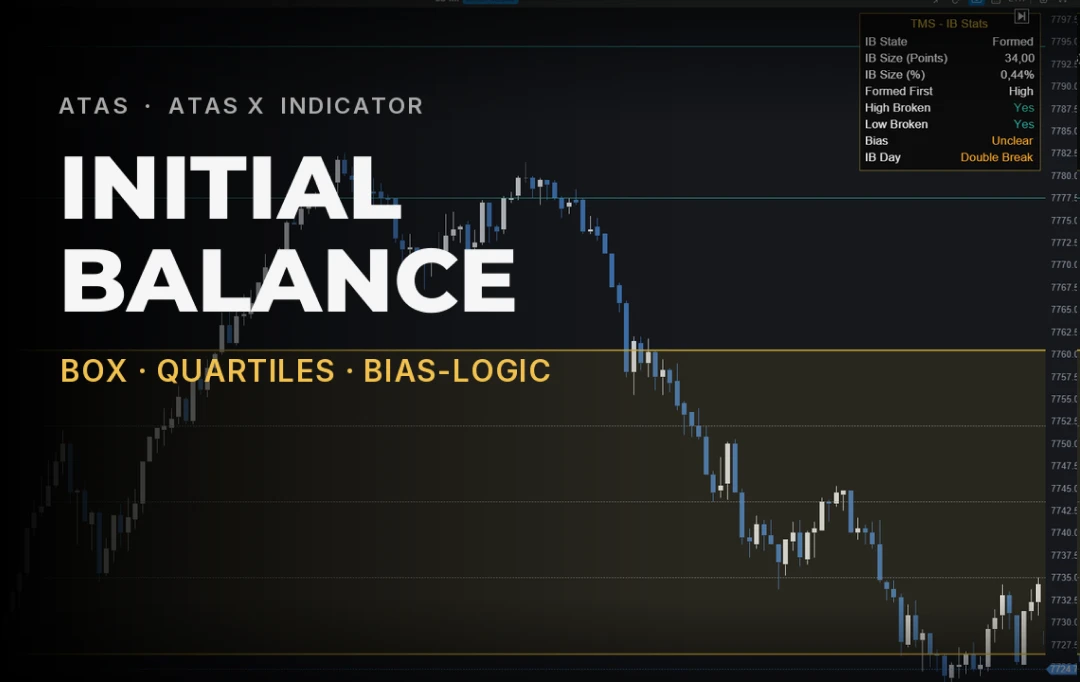
Plots Initial Balance with high/low, quartiles (25/50/75%), and extension levels. Features a stat table with breakout behavior, IB Day types, and directional bias (Long/Short/Unclear) for personal analysis. Built for 1m–15m charts.
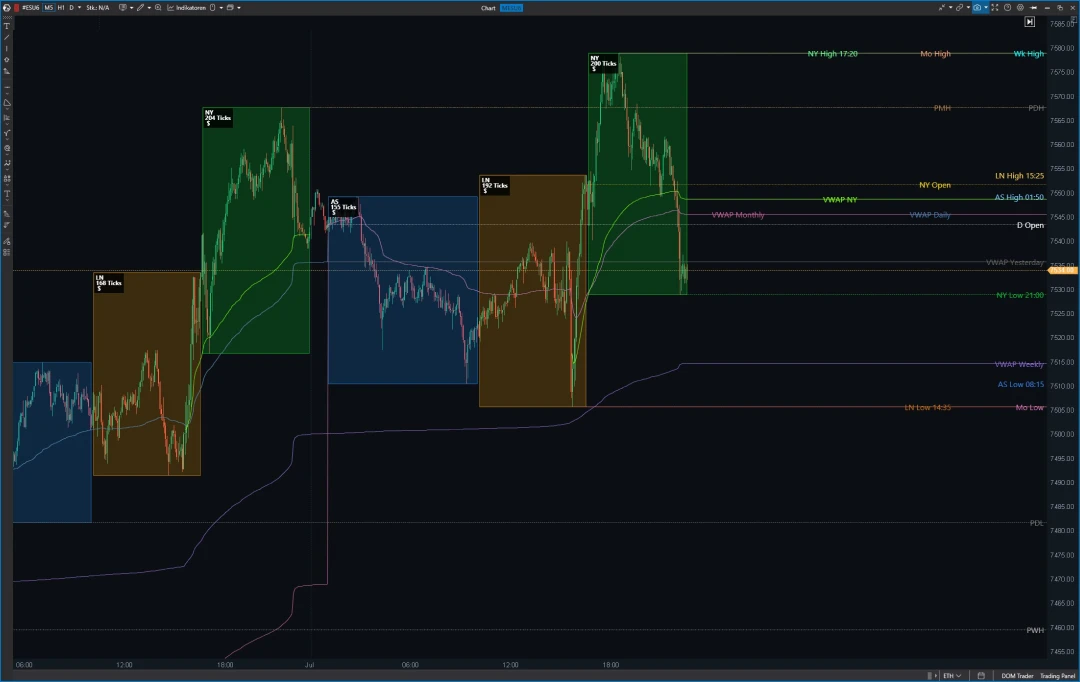
Shows session ranges, Key Levels, and various VWAP levels directly on the chart. All in one tool, fully configurable to the trader's own analysis style.
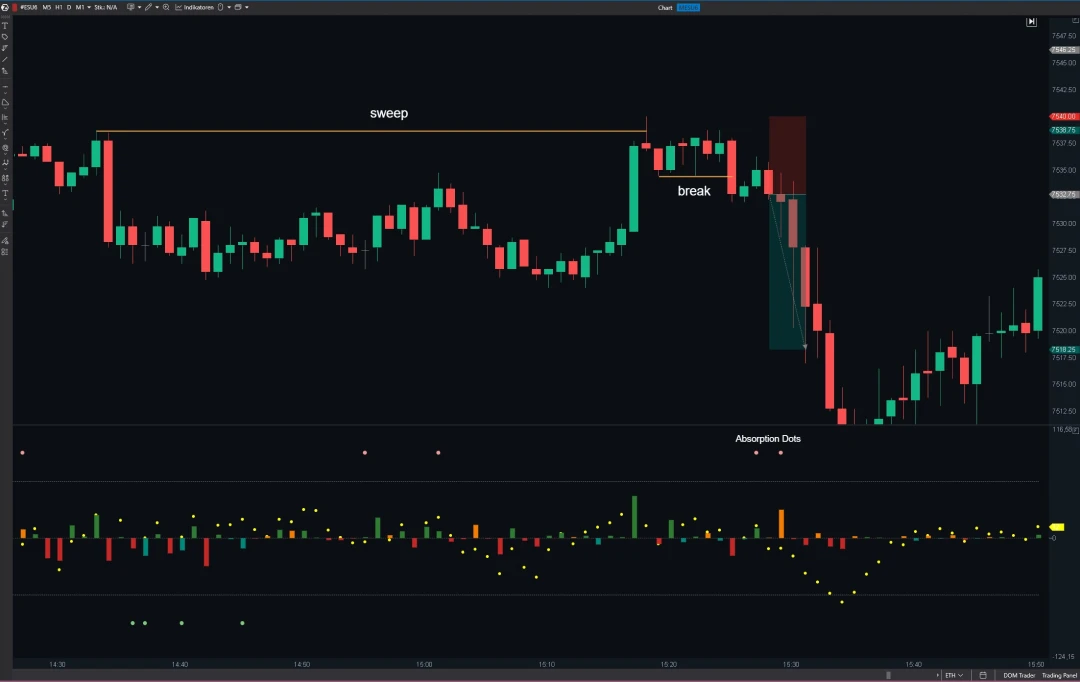
The indicator links aggressive order flow with the actual price reaction, helping traders structurally evaluate control, initiative, efficiency, and absorption.
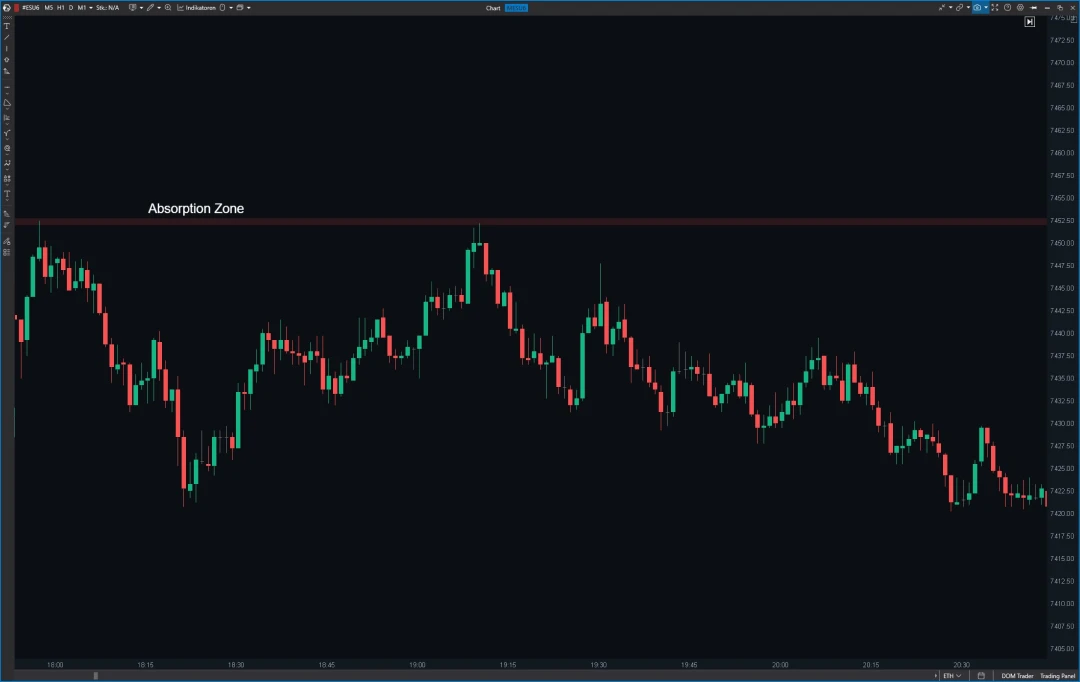
Highlights zones on the chart where price has repeatedly reacted before — ready-made support and resistance reference points, no manual line-drawing required. Not a buy/sell signal, just clean market structure for the trader's own analysis.
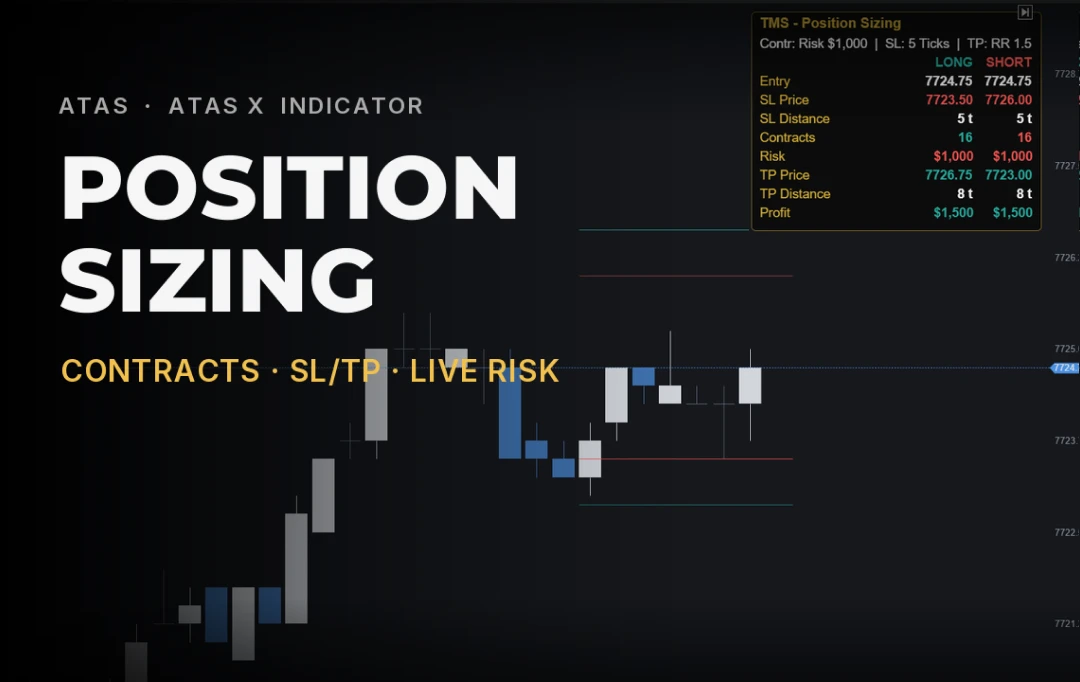
Calculates real-time, tick-exact contract sizes, SL/TP prices, risk, and reward simultaneously for LONG and SHORT. Updates continuously per candle without executing trades. Built for ATAS and ATAS X.
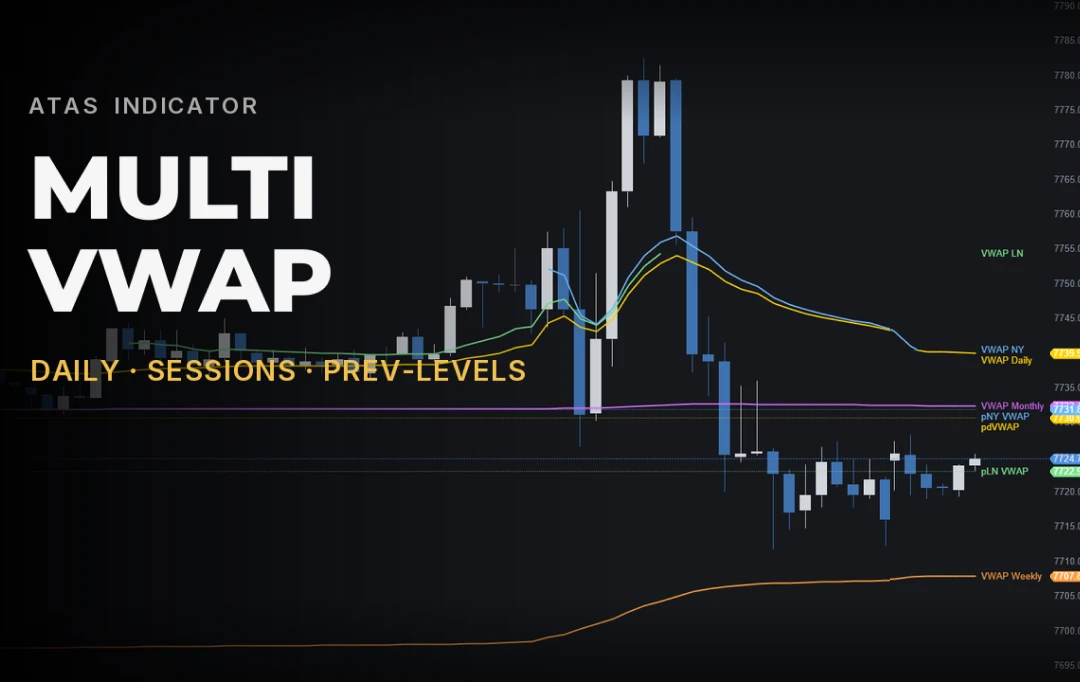
Displays up to 5 custom VWAPs simultaneously (Daily, Weekly, Monthly, London, New York) with individual toggles and color settings. Historical period lines freeze final VWAP levels as support/resistance zones. For ATAS and ATAS X.
TMS-IBS automates Initial Balance breakout trading: measures open range, triggers clean breakouts with pullbacks, and manages entries, SL, TP, and timing. The built-in backtest panel displays performance metrics directly on your chart. For ATAS.
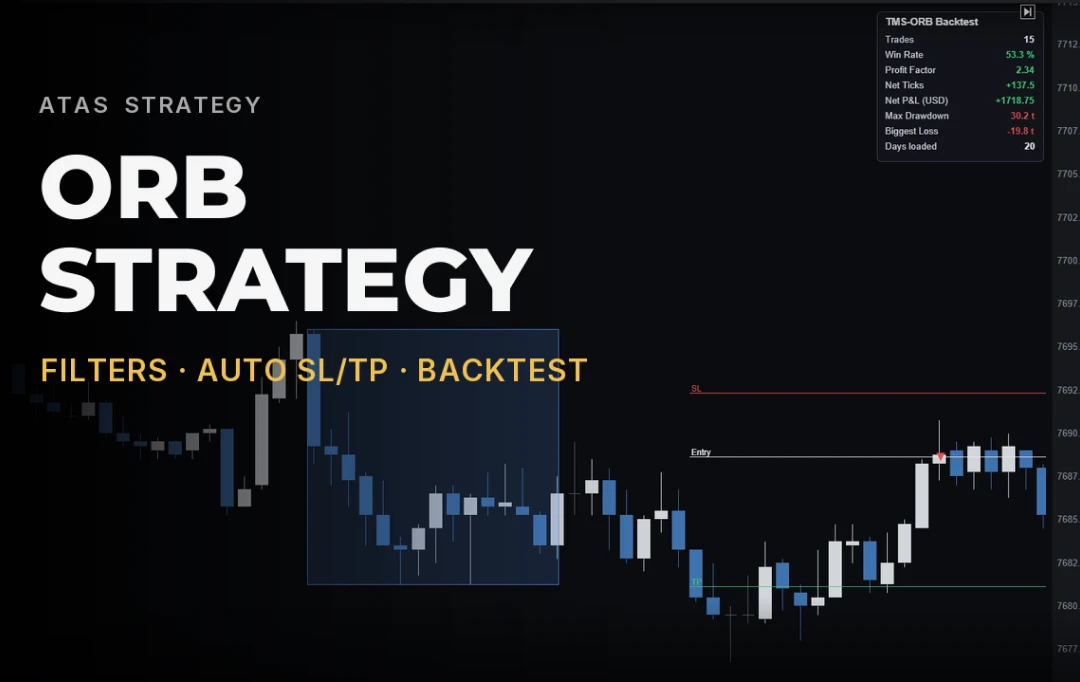
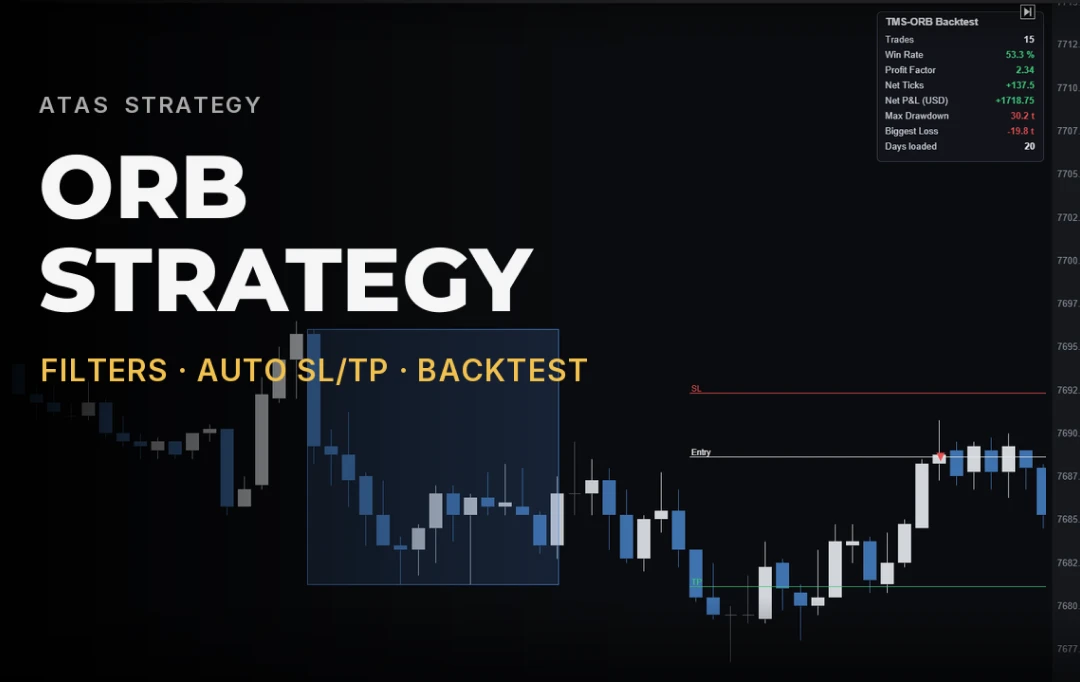
Automates Opening Range breakouts via 3 entry modes with SL, TP, and position sizing. Features daily risk filters and an on-chart backtest panel displaying performance metrics. Designed for ATAS.

In this masterclass you'll learn to read footprint elements, linking them to auction theory and market fundamentals. 8 practical strategies, live examples, and practice material — about 10 hours of video on entries and stops.