
 Publication:17.11.2026
SFE Advanced Volume Profile
- Category: Algotrading
- Asset class: Futures, Stocks, Cryptocurrencies
Description
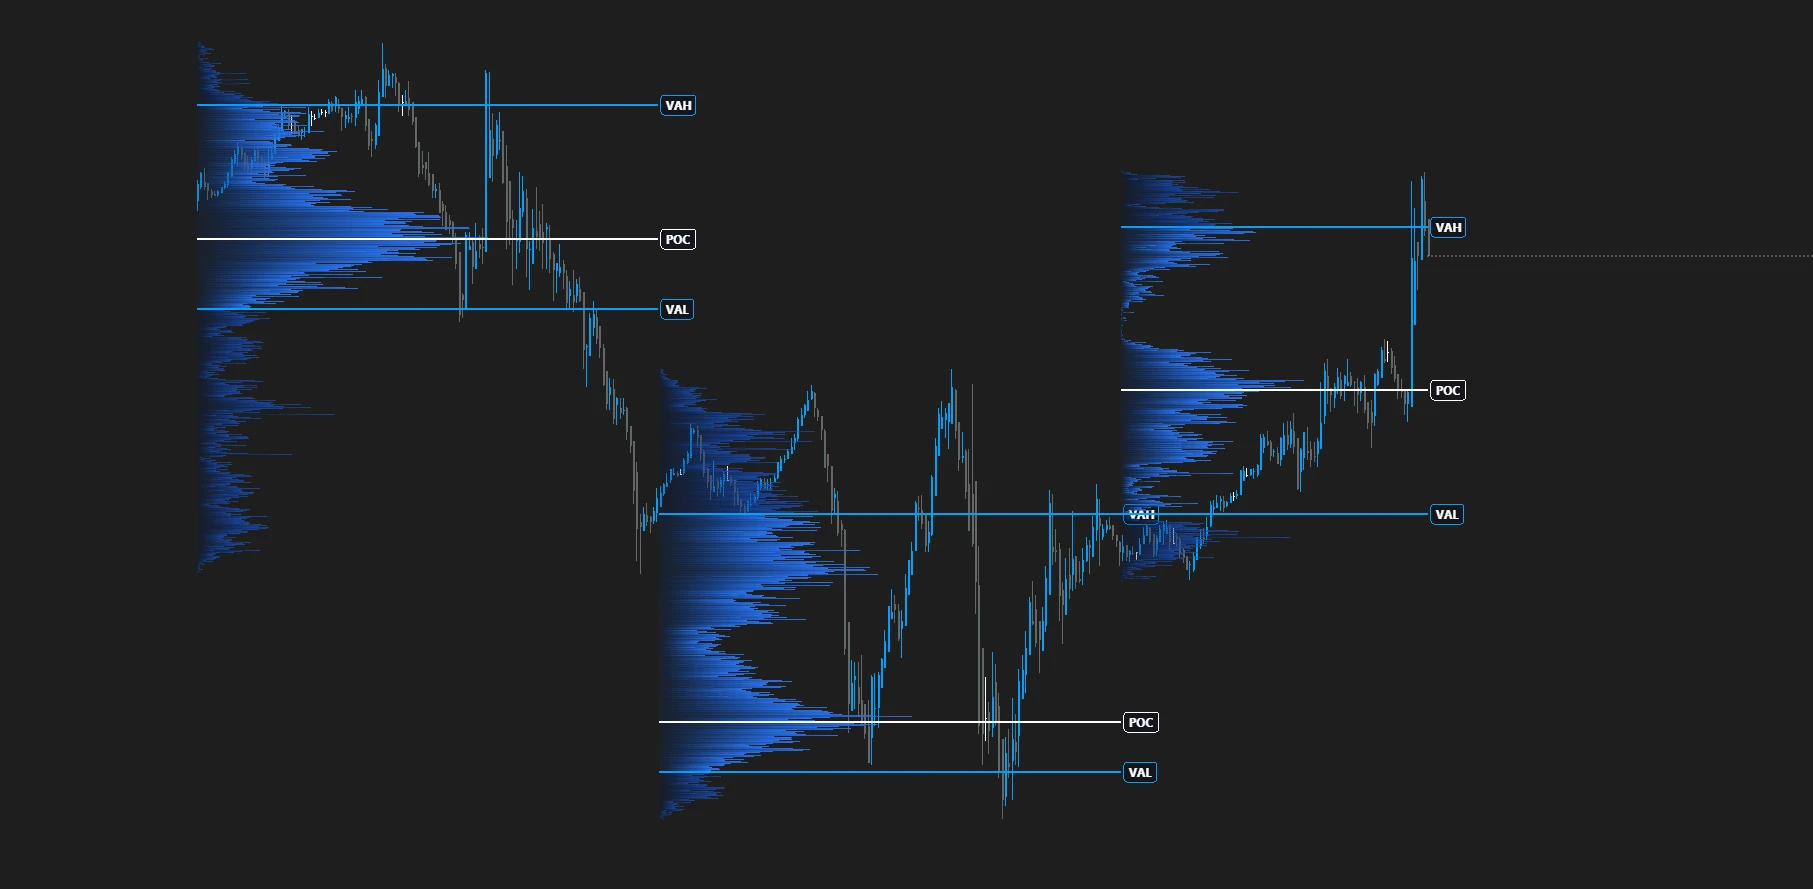
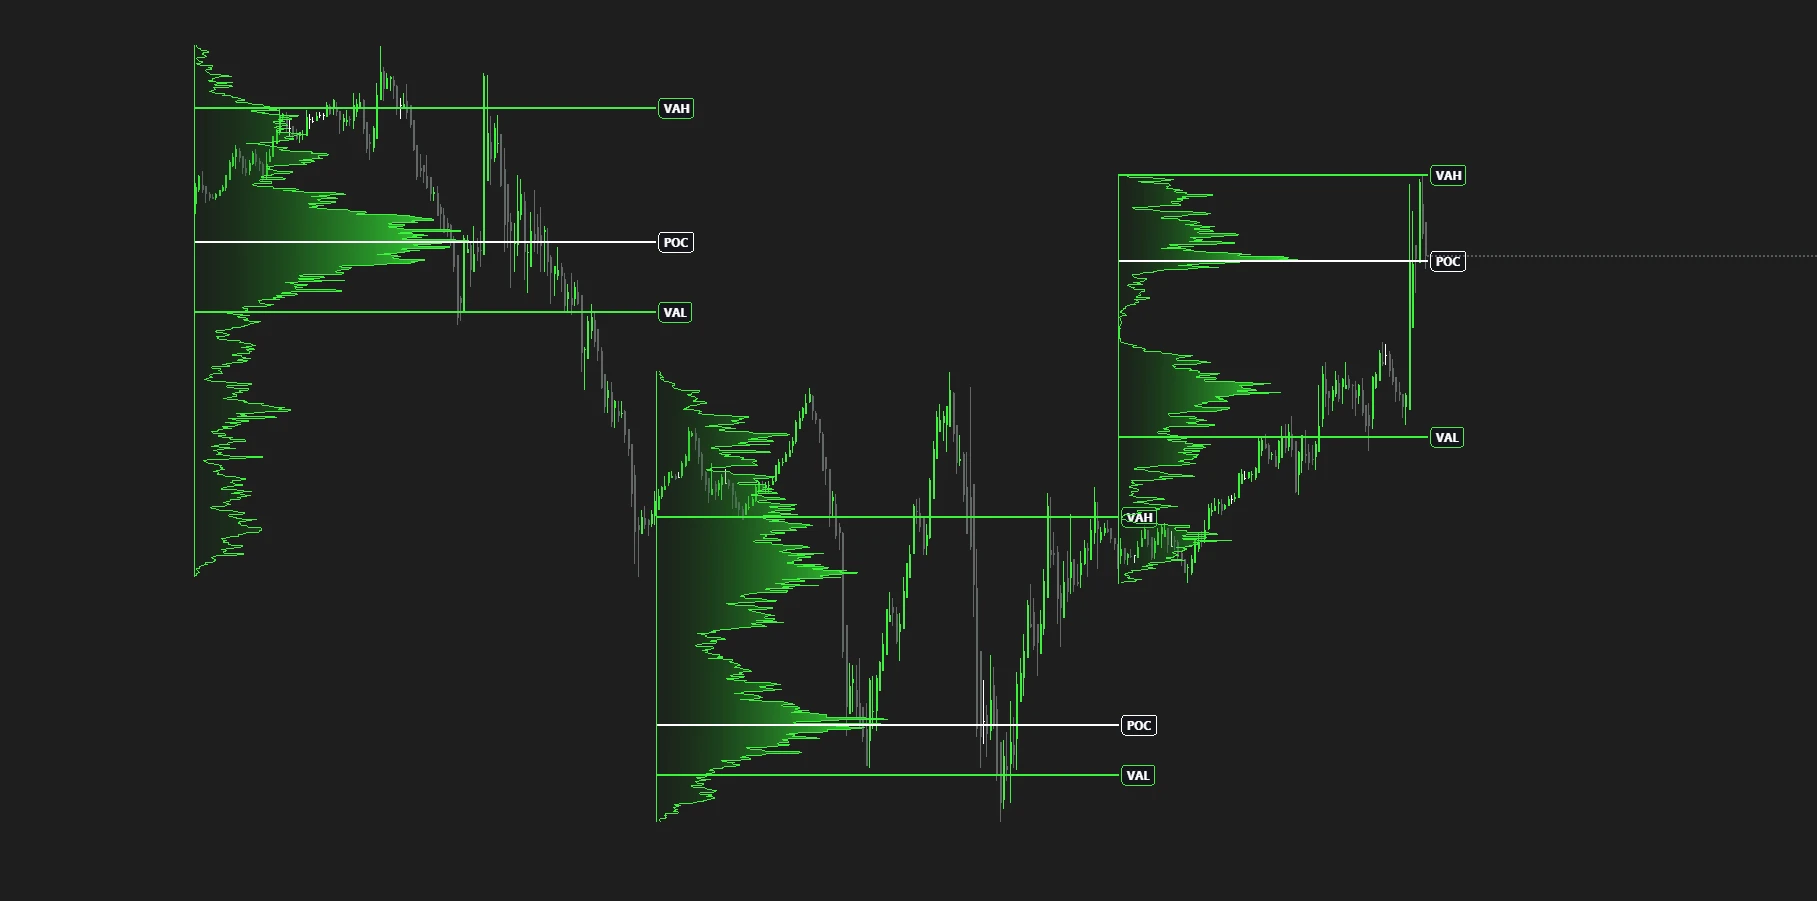
SFE Advanced Volume Profile is a volume and Order Flow analysis indicator for ATAS and ATAS X. It combines multi-period volume profiles, dynamic volume heatmaps and automatic HVN/LVN highlighting. Traders use it to study how volume is distributed across price levels and to build their own view of market structure.
Key Features
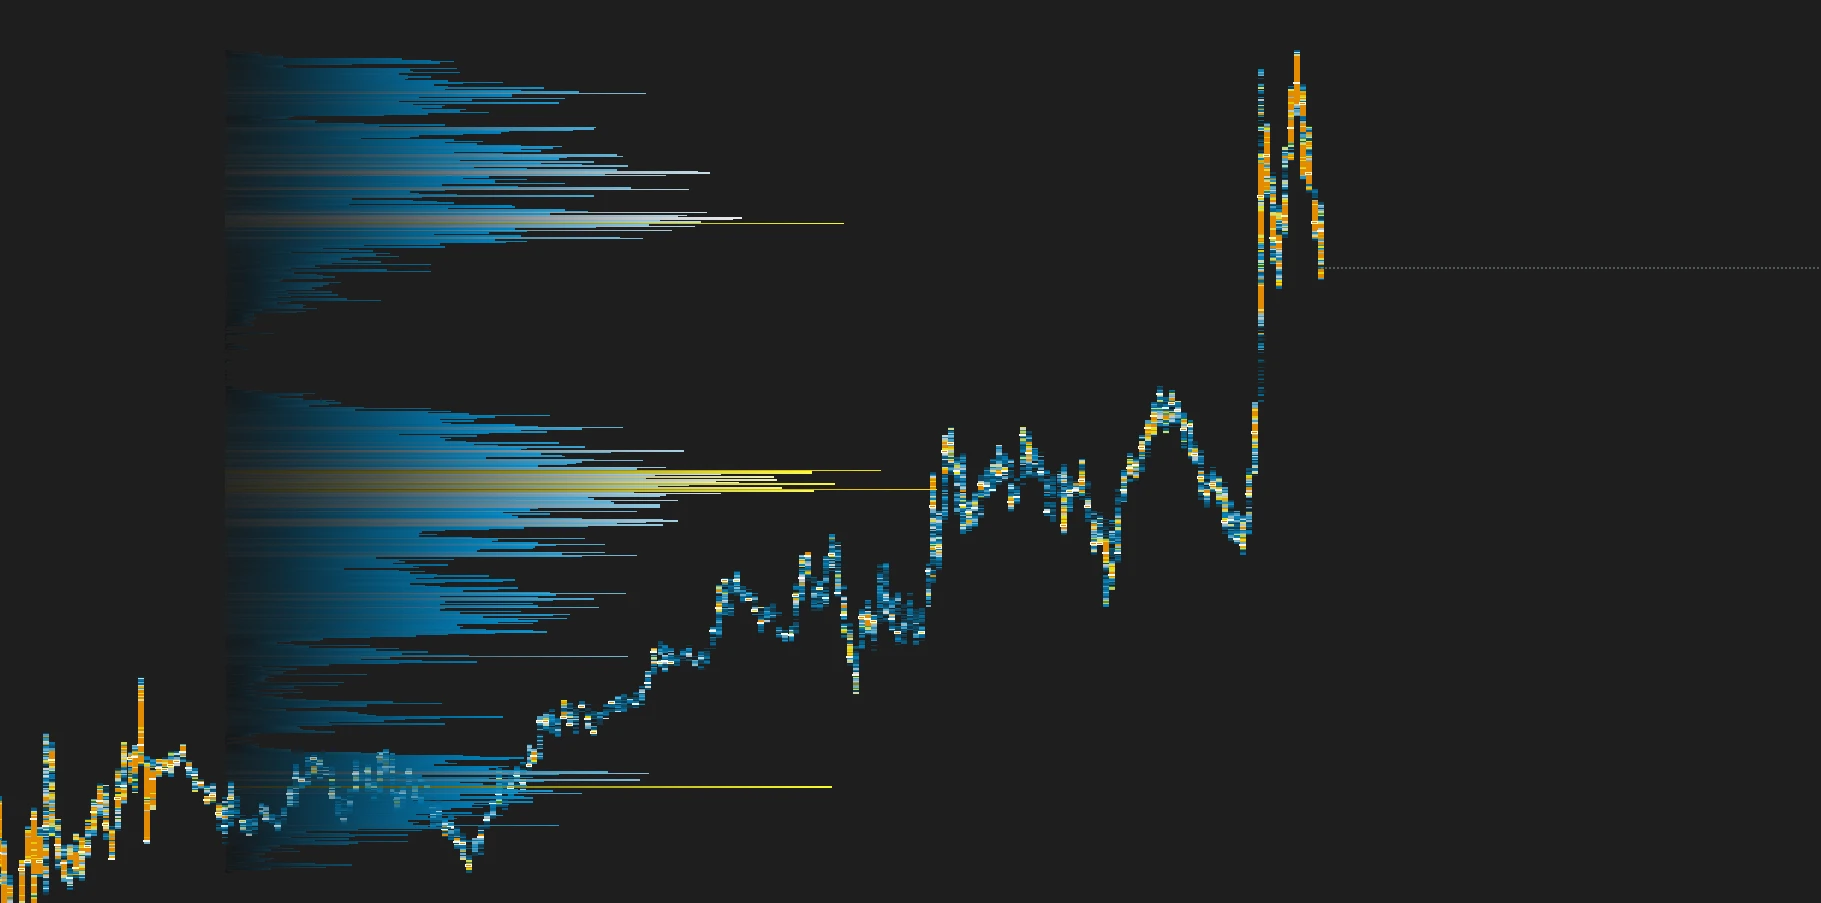
- Dynamic Volume & Candle Heatmap. High-resolution thermal visualization of volume intensity across profile bars and price candles, with customizable color spectrums.
- HVN & LVN Highlighting. The indicator marks High Volume Nodes (prices with concentrated traded volume) and Low Volume Nodes (prices with thin traded volume). Sensitivity is configurable.
- POC, VAH, VAL & Naked Levels. Real-time tracking of core profile levels. Optional naked ray extensions stay on the chart until price returns to the level.
- Developing Levels (dPOC, dVAH, dVAL). Bar-by-bar progression shows how the session’s value area shifts during the day.
- Multi-Period & Interactive Profiles. Session, Daily, Weekly, Monthly, Rolling Lookback, Fixed Bars and Visible Bars profiles. Also supports a draggable anchored vertical line and Ctrl+Click custom ranges.
- Advanced Visual Customization. Continuous silhouette contours, hollow or filled outlines, horizontal gradient fills, and customizable badges for level names and prices.
- Dual Platform Support. Native compatibility with ATAS Classic and ATAS X.
How It Works
SFE Advanced Volume Profile processes tick-level data (Volume, Bid/Ask trades, and Delta) at each price level within the selected timeframe or custom range.
- Aggregation & Structure. Builds a price-volume distribution for each period. Calculates the Point of Control (POC) and the Value Area (VAH/VAL) using the standard auction market theory method (typically 70% of total volume).
- Heatmap Computation. Calculates relative volume density and applies a thermal gradient across the profile and candle bodies, so traders can see where volume is concentrated or thin.
- HVN & LVN Detection. A prominence algorithm evaluates local volume peaks and valleys. Prominent peaks are marked as HVNs and deep troughs as LVNs, according to the user’s sensitivity settings.
- Developing Levels. dPOC, dVAH and dVAL are calculated progressively bar by bar without repainting, showing how value migrated during the session.
- Rendering. All elements are drawn with GPU-optimized rendering, designed for smooth performance on high-volatility instruments. Opacity, outlines and gradient shading are customizable.
Settings
Period & Timeframe Modes
Session (Chart), Custom Time Session, Daily, Weekly, Monthly, Fixed Bar Count, Rolling Lookback Bars, Visible Bars, Draggable Anchored Line and Custom Range.
HVN & LVN Sensitivity
- Toggle peaks and/or valleys
- Adjust detection sensitivity and peak neighbor radius
- Include or exclude boundary extremes
Heatmap & Visual Schemes
- Heatmap palettes: Dark to Violet to Red, Blue to Red, Heat Spectrum, Monochrome
- Silhouette outline fills, horizontal gradient fill, opacity from 5% to 100%
- Profile placement: Left, Center, Right, Margins
Level Styling & Extensions
- Line colors, widths and dash styles for POC, VAH, VAL, dPOC, dVAH, dVAL, HVNs and LVNs
- Extension modes: Stop at Profile, Extend to Window, or Naked Rays until price touch
Text & Readout Badges
- Volume and delta numerical summaries
- Customizable level labels (VAH, POC, VAL) with adjustable font size and colors
- Badge positions: Box in Front, Above, Below, On Line
Chart Integration
- Display the profile above or behind price candles
- Hide chart candles for dedicated profile analysis
Analysis Scenarios
These are examples of how traders apply the indicator in their own analysis. All conclusions and decisions are made by the trader.
- Price Behavior Around LVNs. Traders observe whether price moves quickly through low-volume areas or returns from them. They use these observations to assess continuation and reversal scenarios in their own analysis.
- Value Area & HVN Context. In range-bound conditions, traders compare price moves beyond VAH/VAL with the location of the POC and major HVNs. This shows whether price is moving away from high-volume areas or back toward them.
- Developing POC Dynamics. By watching how the dPOC progresses (rising steadily or staying flat), traders evaluate whether value is migrating or the market is balancing. They factor this into their own assessment of breakouts.
- Heatmap Volume Analysis. Traders use the heatmap on profile bars and candles to study volume concentration near session highs and lows, including possible signs of absorption or exhaustion.
- Event-Anchored Analysis. Traders place the draggable anchored profile on high-impact events (CPI releases, Fed announcements or session opens). This lets them study how market structure has developed since that event.
Pricing
- 7-Day Free Trial: full access to all features
- Monthly Plan: $37 / month
- Quarterly Plan (3 Months): $111
- Lifetime License: $499, one-time purchase including future updates
SmartFlow Edge is a team of hands-on, practicing traders specializing in developing volume and order flow analysis tools for futures markets. Its proprietary indicator lineup includes Volume Profile and price delta tools, ready-made chartbooks, and custom development for ATAS and ATAS X. The subscription includes not only indicators but also educational materials, session-prep breakdowns, and access to the Discord community.
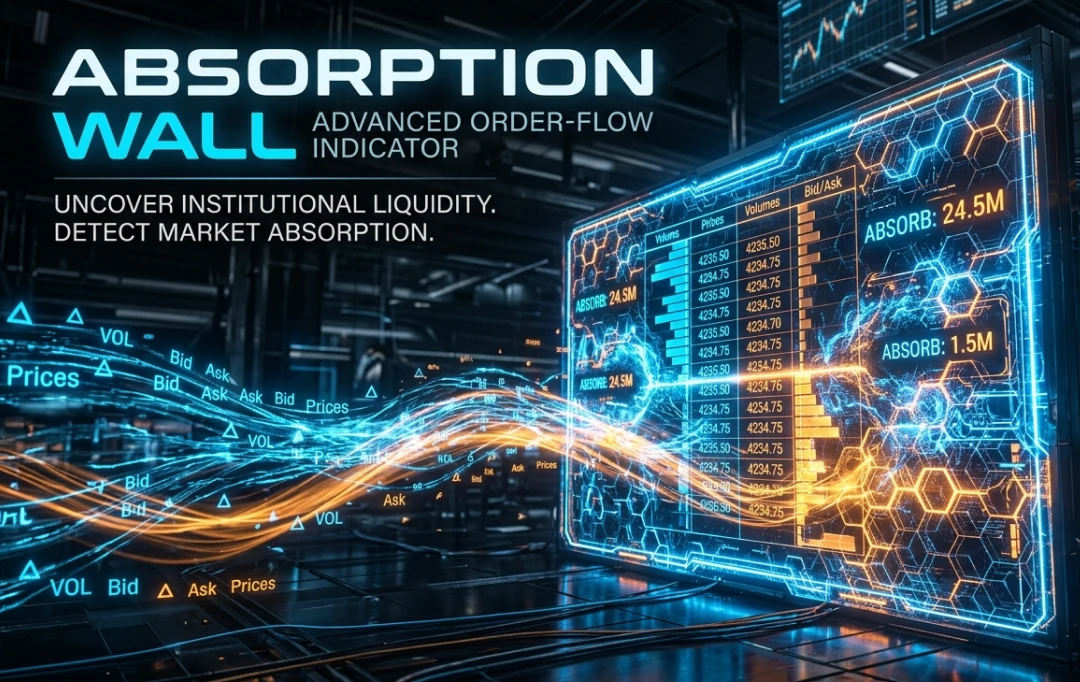
Detects limit walls on footprint charts — levels where high volume absorbed aggressive orders. Highlights absorption zones and builds support/resistance zones using imbalance ratio and candle anatomy. Compatible with ATAS Classic and X.
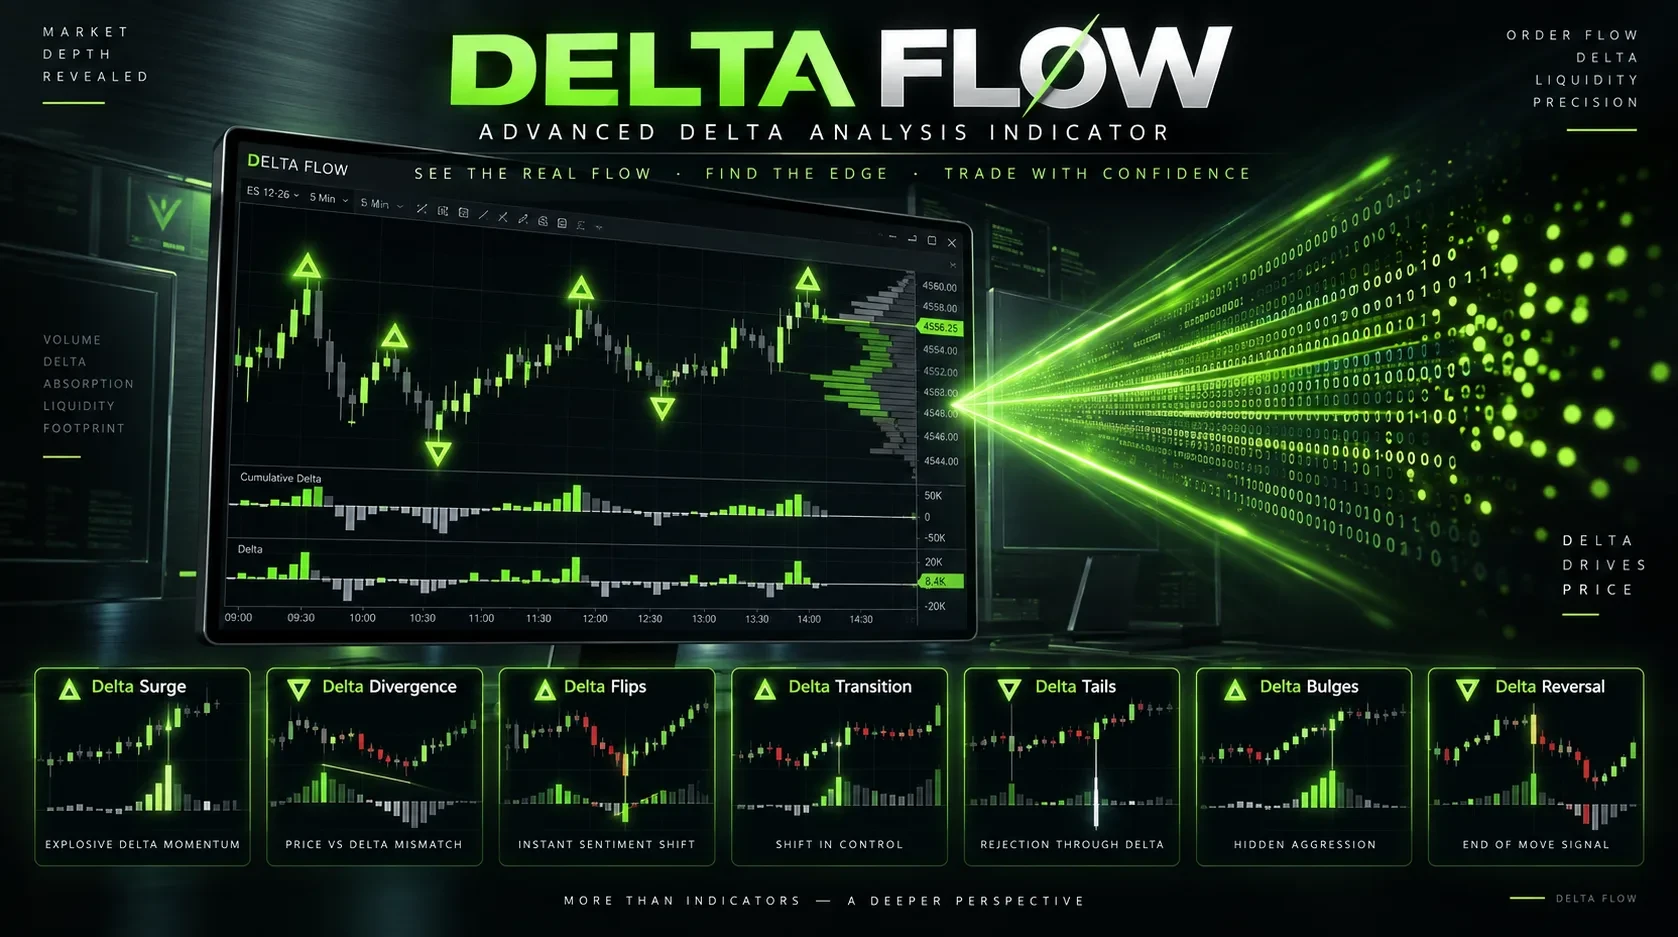
Advanced order flow indicator for ATAS: highlights seven delta-based patterns — Surge, Divergence, Flips, Transition, Tails, Bulges, and Reversal. Helps spot momentum shifts, failed breakouts, and potential reversal conditions.
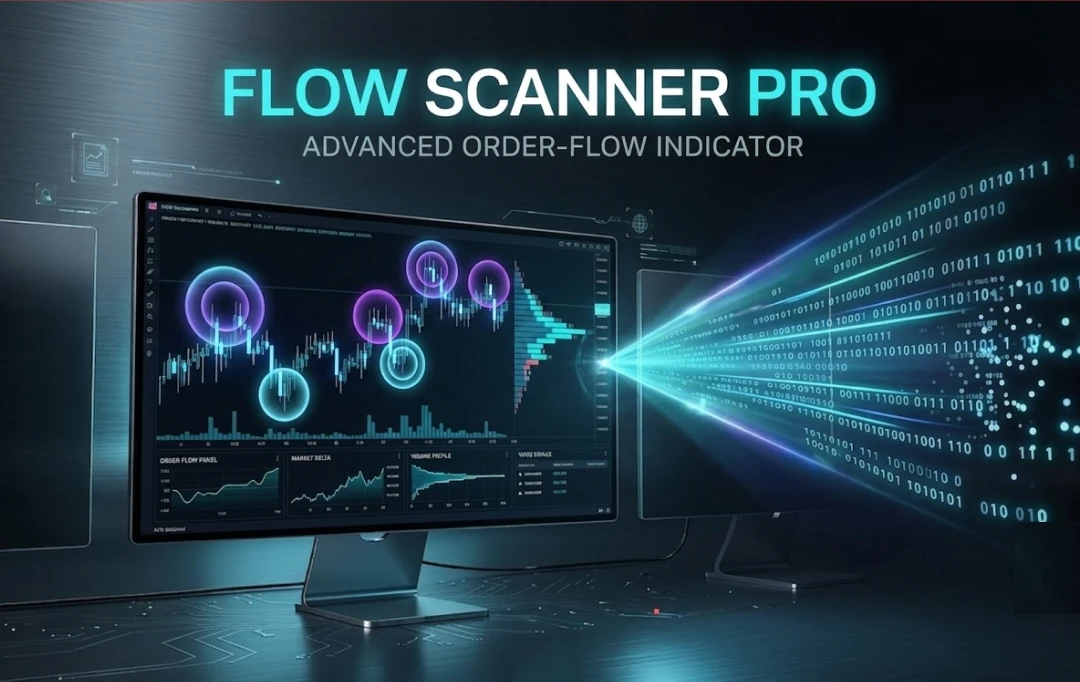
A big-trade and order flow indicator for ATAS that flags significant market orders using dynamic volume thresholds. Structural filters let traders isolate aggressive executions within specific candle zones — body, wicks, highs, lows.
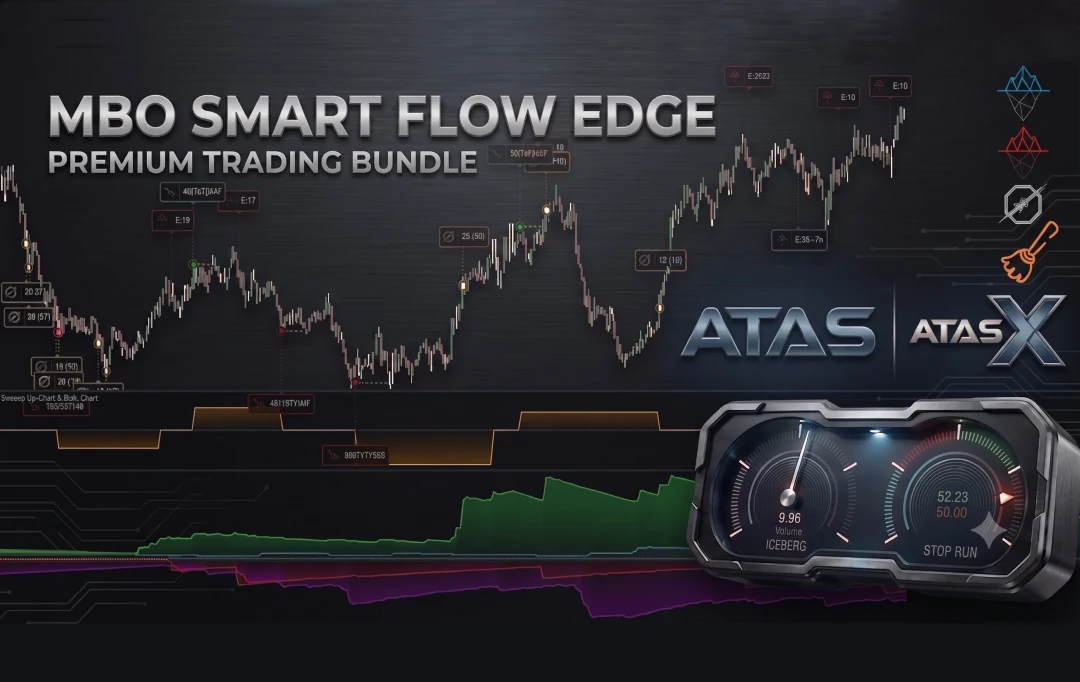
MBO Smart Flow Edge analyzes order flow using Market By Order data: it detects iceberg orders, stop-loss triggers, and aggressive market sweeps on the chart and in a separate panel. Helps you spot significant liquidity and potentially meaningful setups.
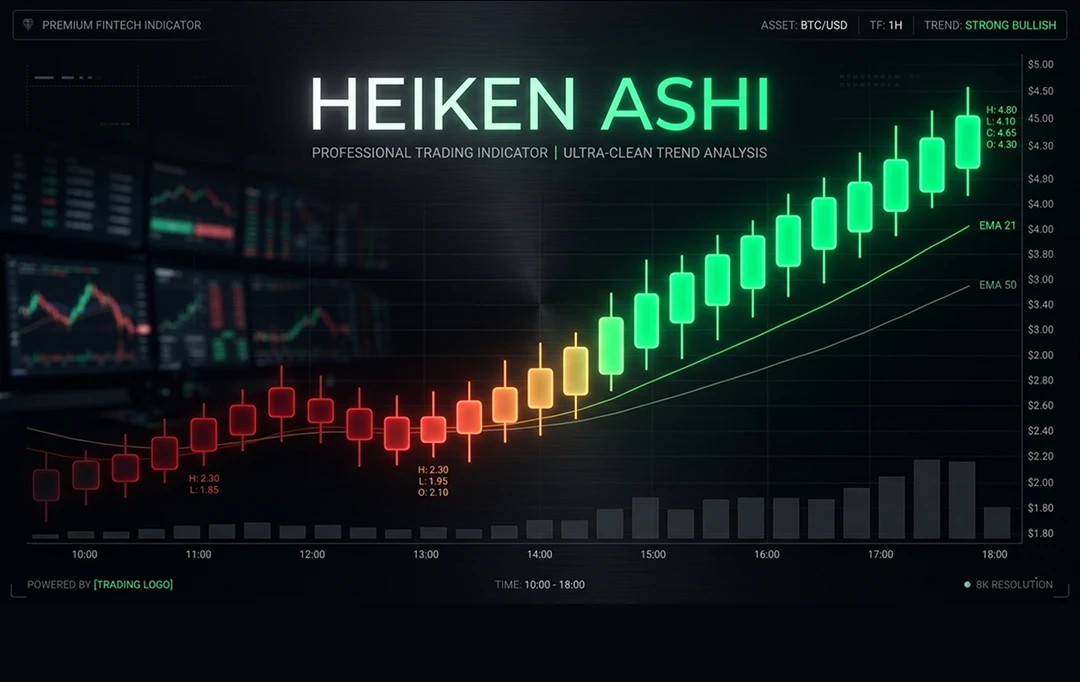
Smooths candles directly on the chart, filtering out market noise. Helps traders more easily read trend direction and potential signs of exhaustion. Compatible with ATAS Classic and X.
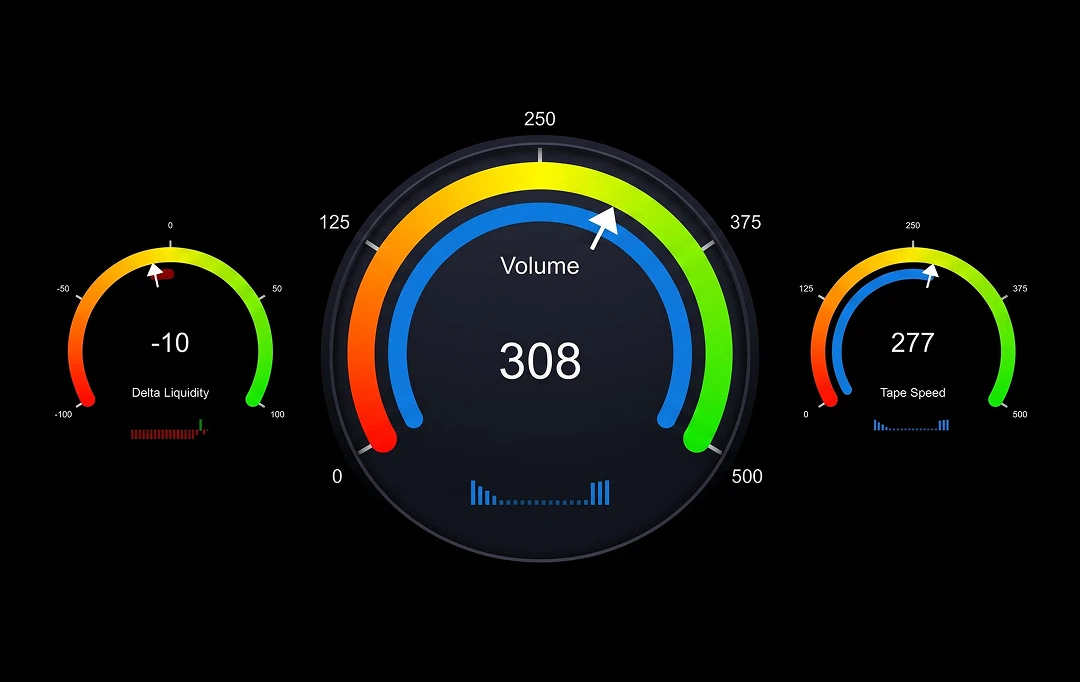
A real-time order flow dashboard: shows momentum and liquidity on the chart using needle gauges. Up to 7 metrics (Speed of Tape, Delta DOM, Delta Volume) help traders quickly read order book pressure. Compatible with ATAS Classic and X.

SmartFlow Edge turns complex quantitative and order flow strategies into indicators, algorithmic solutions, and low-latency analytical software — integrated with the ATAS Classic and ATAS X analytics platforms.
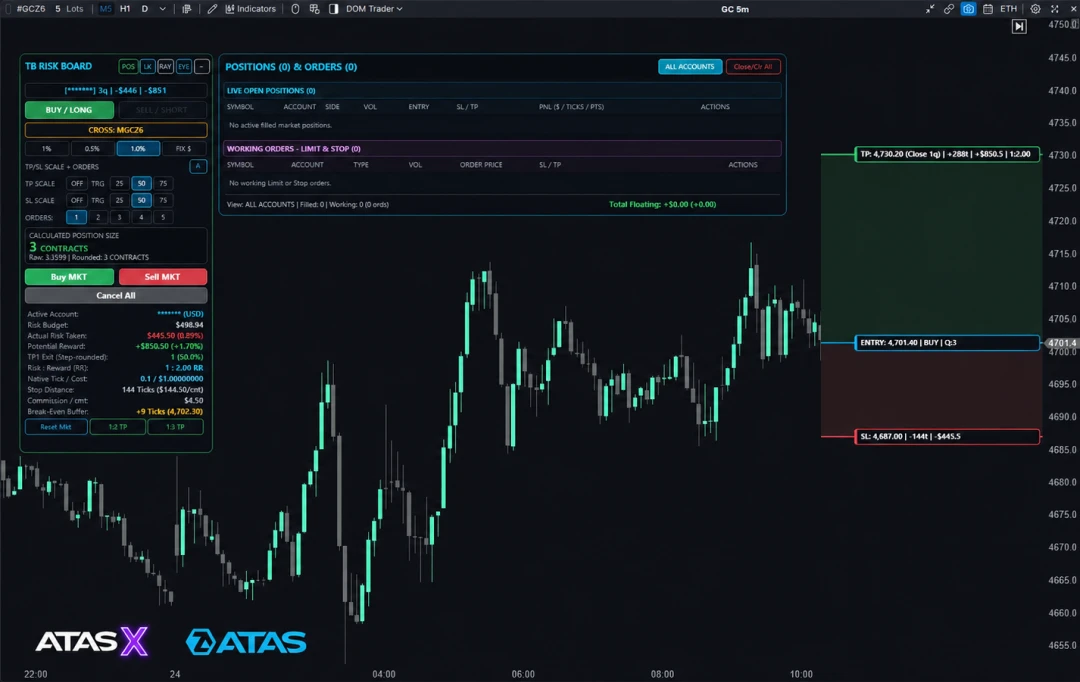
Risk panel on ATAS chart: interactive Entry, Stop Loss, and Take Profit lines calculate exact lot size, $ risk, and R:R in real time. One-click execution, automated breakeven, trailing stop, order scaling, and max risk control.