
 Publication:06.11.2026
Delta Tail
- Category: Algotrading
- Asset class: Futures, Stocks, Cryptocurrencies
Description
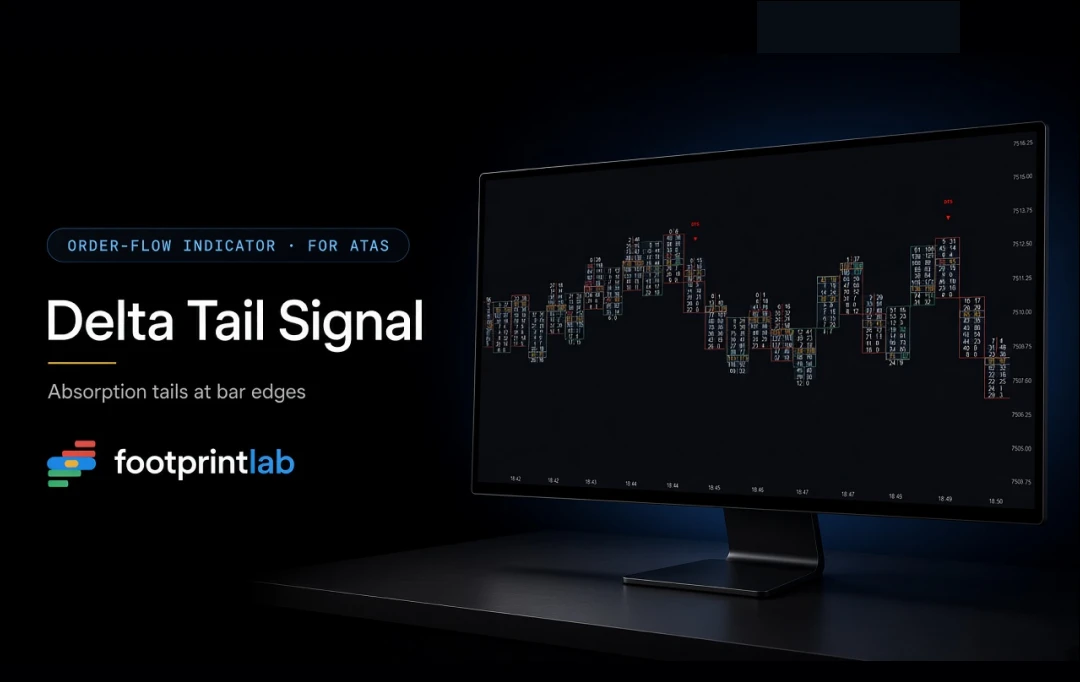
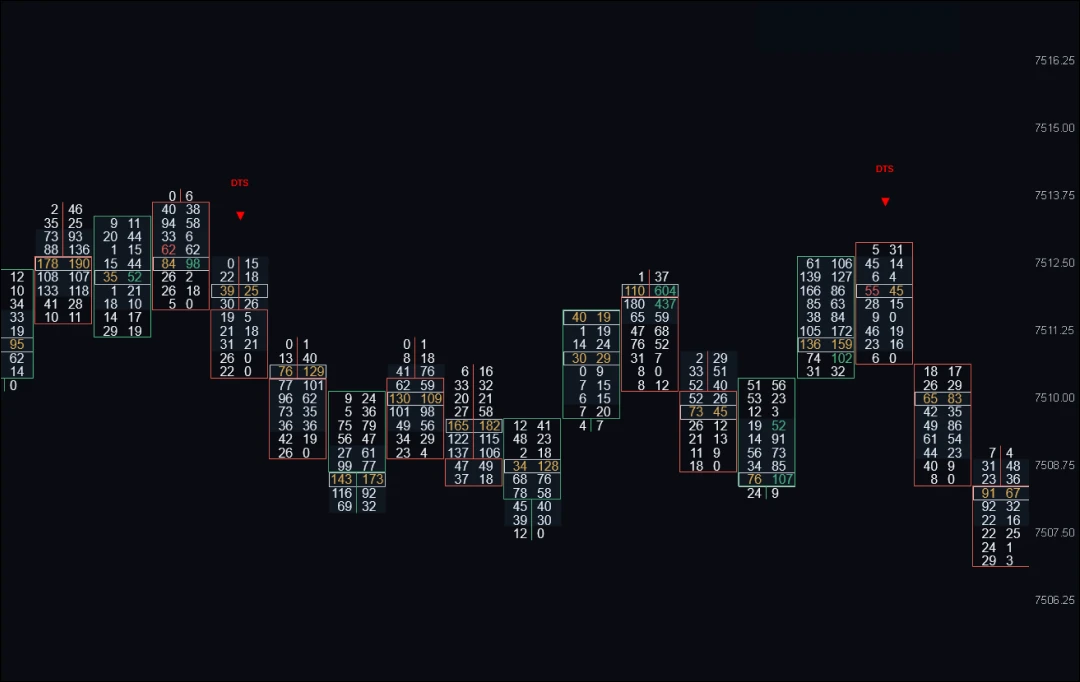
Delta Tail is an indicator for ATAS footprint charts. It highlights bars featuring a micro-absorption pattern: a narrow tail of opposing delta at the bar's extremum followed by a uniform body with delta of the same sign. This pattern indicates that aggressive orders at the edge of the bar were absorbed while the rest of the bar moved in the opposite direction. The indicator spares traders from manually scanning clusters for this pattern, leaving the final analytical decision to the trader.
How the Indicator Works
-
Level-by-Level Delta
On each closed bar, the indicator pulls the full footprint (bid and ask at every price level) and calculates delta at each level as ask minus bid, from bottom to top.
-
Tail Detection
-
Bullish bar (close above open): a sequence of levels with negative delta at the very low.
-
Bearish bar: a sequence of levels with positive delta at the very high.
A tail is valid if its thickness ranges from 1 tick up to the Max Tail Levels setting and does not occupy the entire bar.
-
Body Verification
Every level beyond the tail must feature a delta of a single sign: positive for a bullish bar, negative for a bearish bar. This ensures the body is unidirectional rather than mixed.
-
Chart Marker
If both conditions are met, the indicator places a marker below the low of a bullish bar or above the high of a bearish bar. Dojis and bars lacking footprint data are skipped.
Key Features
-
Calculations run exclusively on closed bars; forming bars are never marked. Placed markers do not repaint.
-
Display modes: shape, text, or both simultaneously.
-
Markers: arrow, diamond, square, or circle, with customizable labels.
Settings
-
Max Tail Levels (1–10): lower values enforce a stricter absorption definition; higher values accept thicker tails.
-
Max Bars Back: historical calculation depth (0 = full history) for performance optimization.
-
Display Mode: Shape, Text, or both.
-
Shape: marker style, size (Shape Size), and tick offset (Shape Tick Offset).
-
Text labels: separate for bullish and bearish markers, with custom offset and font size.
-
Colors: separate settings for bullish and bearish markers.
Use Case Examples
-
ES, 1,500-contract footprint: Price drops toward a previous swing low, and a green arrow appears beneath the low. The bar closed higher, negative delta (selling) is restricted to one or two lower ticks, and all levels above show positive delta. The trader evaluates this pattern in conjunction with their own key level.
-
NQ: Price quickly tests resistance, and a red marker appears above the bearish bar's high. The top tick shows positive delta (buying), while the entire body below shows negative delta. This visually highlights the absorption of the push into the high.
The author recommends looking for this pattern around intraday swing highs and swing lows during liquid trading hours as an additional factor in personal reversal analysis.
Requirements
Requires bid/ask data for every price level. Not suitable for spot Forex.
Pricing
$59.90 — one-time purchase, no subscription, Lifetime update support.
Footprint-Lab is a developer of professional analytical tools and trading panels for ATAS. The company specializes in products for deep Order Flow analysis, volume profiling, and automated risk management. Their product lineup includes the JSI Pattern Research pattern backtesting system, the Pattern Runner live monitoring module, and the SFE TradingBoard interactive risk calculator. All Footprint-Lab solutions are built with zero "black box" code and fully integrate with ATAS charts and historical data.
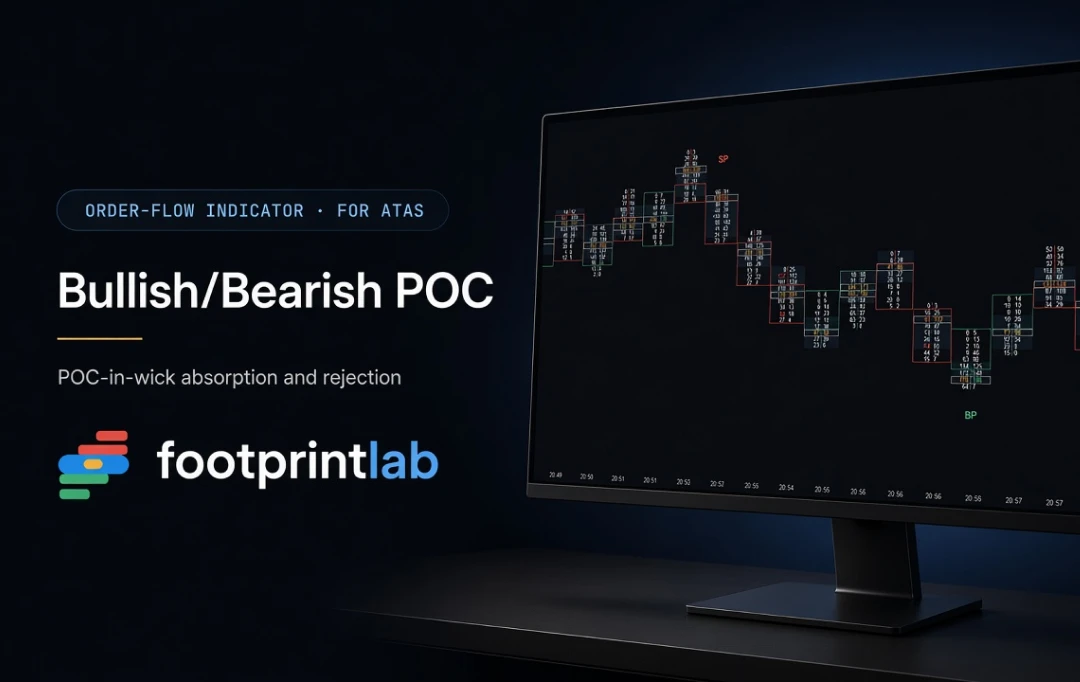
Automatically marks bars where Point of Control forms in the candle wick — signaling potential absorption and rejection. Displays BP/SP markers when met, plus Continuous-POC for high-volume accumulation levels.
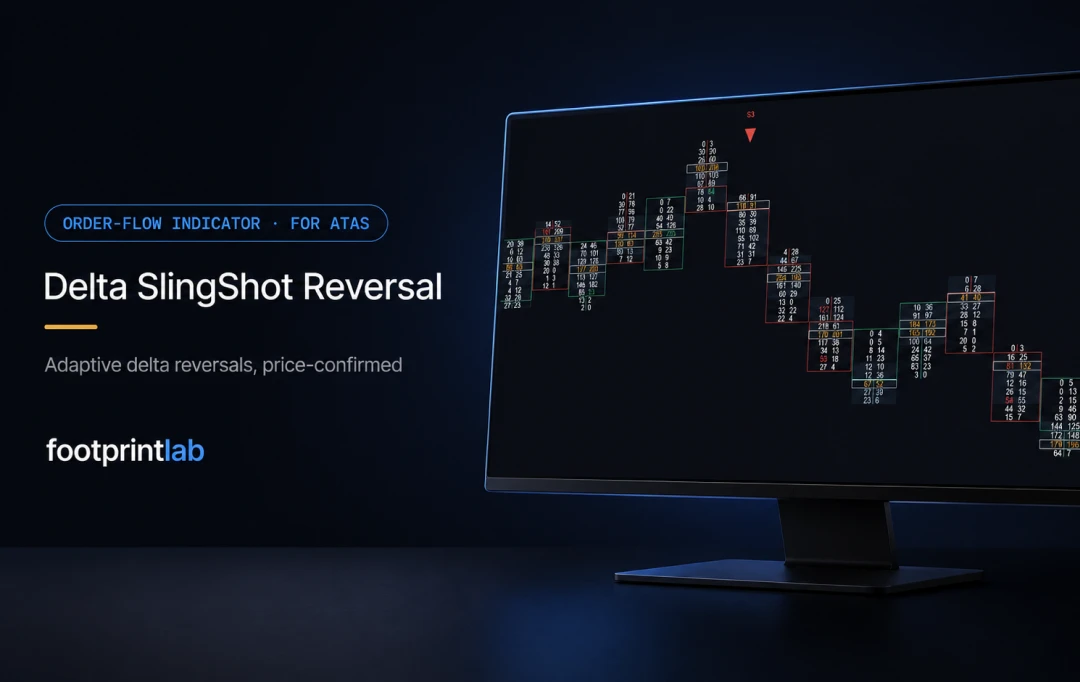
Adaptive delta reversal indicator marking sudden shifts in buyer/seller aggression via a self-calibrating band with price confirmation. Dynamic thresholds adjust automatically to session volatility instead of fixed values.
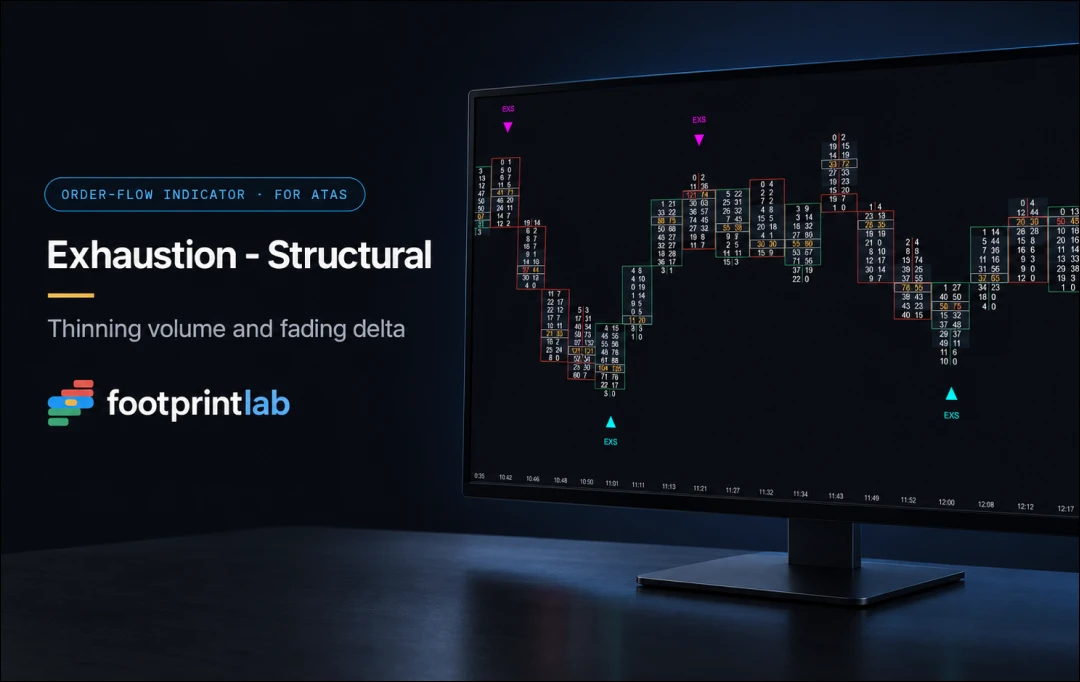
Marks new highs and lows with fading volume and weakening delta. A bar is marked only if at least two out of three conditions are met; thresholds adapt to each bar's volume.
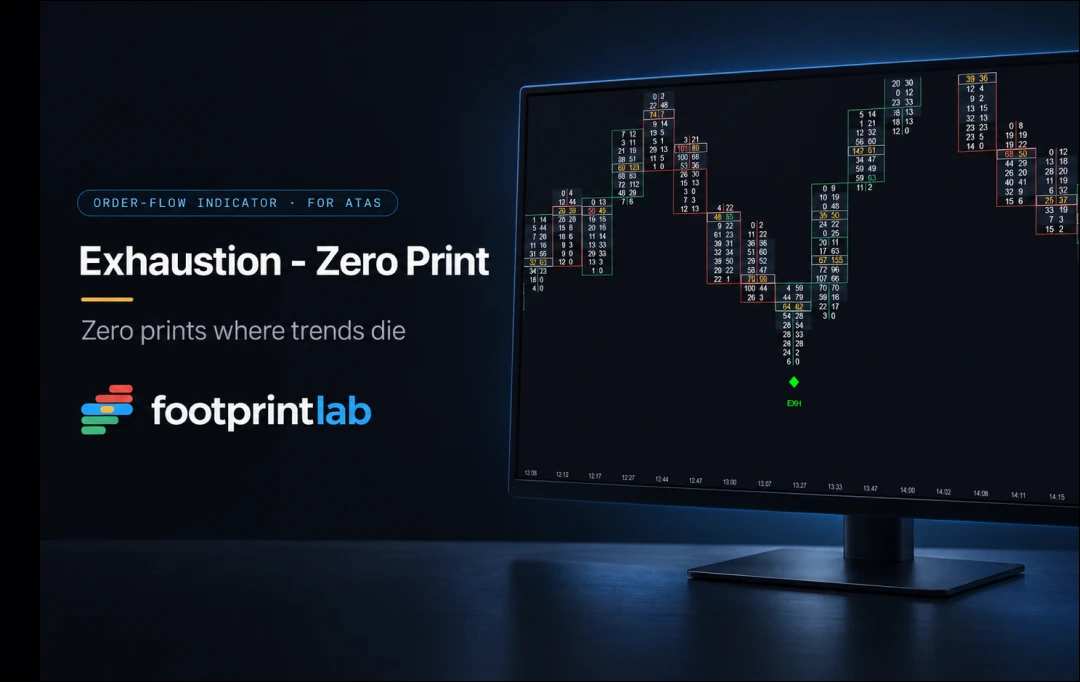
Marks bars with zero or near-zero volume on the extreme tick and a reversal candle following a series of trend bars. Calculated using the full footprint; volume threshold and trend length are configurable.
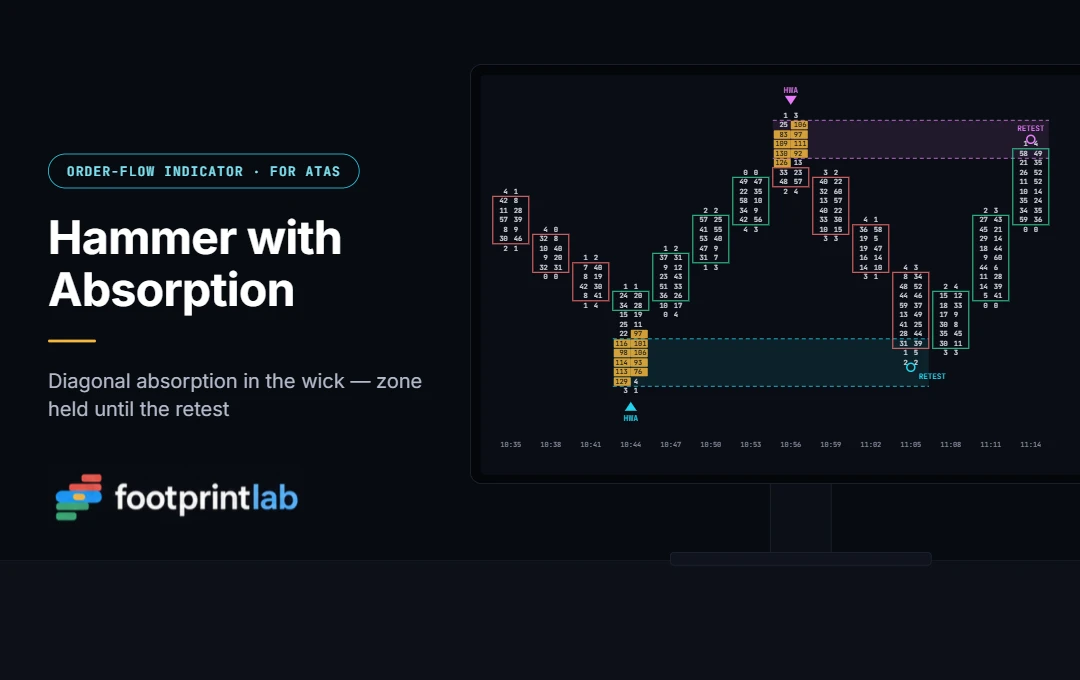
Marks hammers and inverted hammers only if the footprint shows a sequence of diagonal absorption within the long wick. The absorption zone extends to the right until retested.
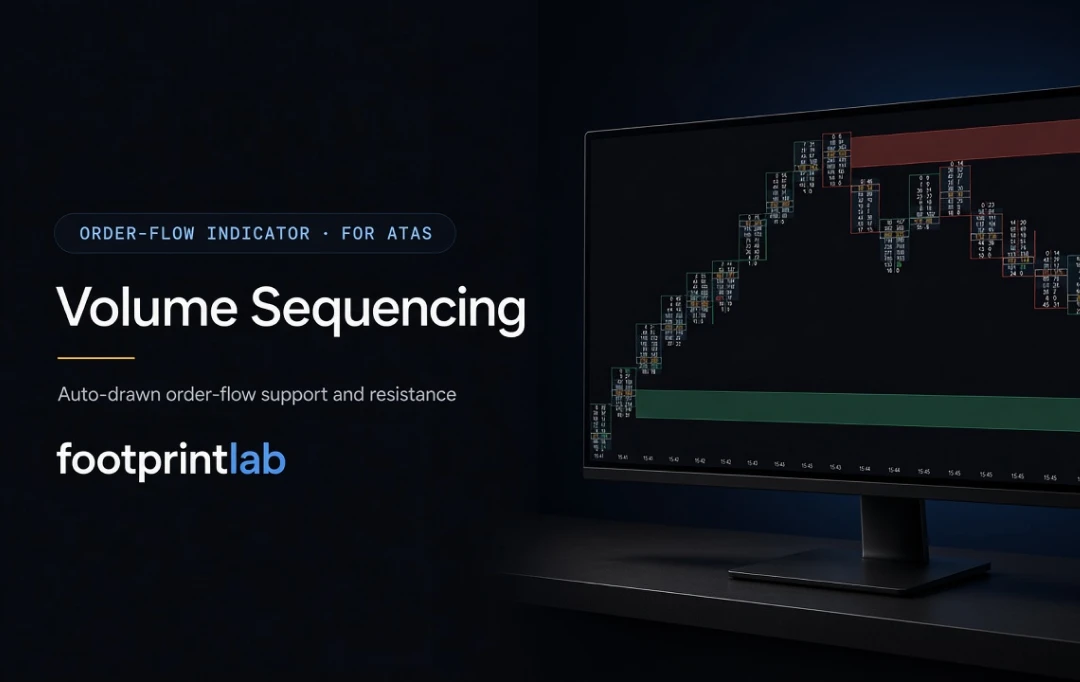
Automatically builds support/resistance zones where aggressive buyers or sellers stacked strictly increasing volume up the price ladder to an extreme. Turns manual footprint reading into clear, actionable zones that hold until tested.