
 Publication:06.11.2026
Exhaustion - Structural
- Category: Algotrading
- Asset class: Futures, Stocks, Cryptocurrencies
Description
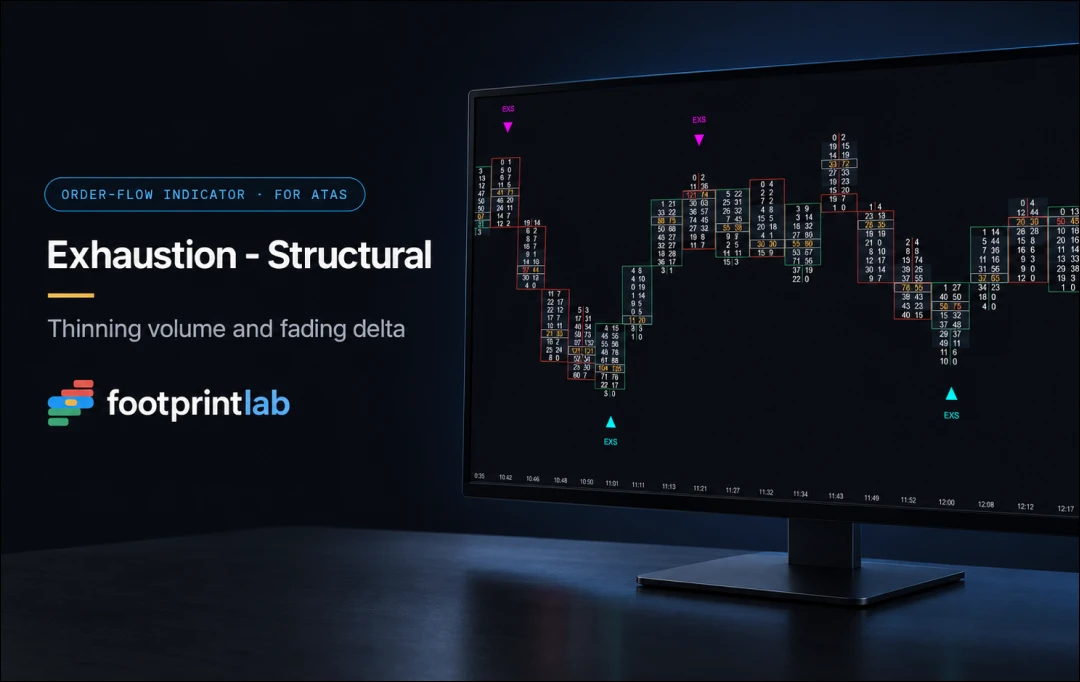
Exhaustion - Structural is an indicator for ATAS footprint charts. It highlights new highs and lows formed on fading volume and a weakening delta. All thresholds dynamically adapt to the volume of each individual bar, and a marker appears only if at least two out of three independent conditions are met on the same bar. The trader evaluates the significance of the marked bar for the ongoing price action.
How the Indicator Works
On each closed bar, the indicator builds a tick-by-tick volume profile (ask plus bid at each level) across the entire range from high to low. Bars narrower than 4 ticks are skipped. Three checks are then performed:
-
Volume Fading: The indicator compares the average volume in the outer part of the extremum to the inner part. The condition is met if the outer-to-inner ratio is below the Weakness % value.
-
Weak Prints at the Extremum: The indicator counts consecutive levels right at the extremum where volume does not exceed an adaptive threshold (Weakness % of the average volume per tick in that bar). The condition is met if these levels fill the entire scan zone.
-
Delta Weakening: Checked only on a confirmed new high or low. The bar's delta is compared against the average delta of preceding bars. If delta has weakened, the condition is met. If it has completely reversed sign against the extremum, it is recorded as a delta reversal.
Chart Marker
A bar is marked if a minimum of two out of three conditions are met. A distinct color is reserved for a full delta reversal: positive delta at a new low, or negative delta at a new high.
Key Features
-
Three independent checks: volume fading into the extremum, a series of weak prints at the extremum, and delta weakening or reversal at the new high/low
-
Confluence filter: markers appear only when at least two of the three conditions coincide
-
Confirmation of a new extremum relative to a specified number of preceding bars
-
Dedicated color for bars featuring a full delta reversal
-
Adaptive thresholds based on volume-per-tick in each bar, ensuring consistent performance across calm and volatile bars
-
Fully customizable display: Shape, Text, or Both, four marker styles, offsets, sizes, and colors
Settings
-
Lookback Period: calculation depth (0 = all bars)
-
Scan Zone % of Bar Range: percentage of the bar range checked at the extremum
-
Weakness %: primary sensitivity parameter; lower values mean stricter filtering
-
Fading Delta Lookback Bars: number of bars used to confirm new highs/lows and calculate average delta
-
Display Mode & Shape: Shape, Text, or Both; Arrow, Diamond, Square, or Circle
-
Offsets & Sizes: tick offsets for markers and text, marker and font sizes
-
Labels & Colors: separate settings for bullish and bearish markers, plus dedicated colors for delta reversal bars
Use Case Examples
-
ES, 2,000-contract footprint: Price makes a session high. The upper ticks print on low ask volume, while the bar's delta—strongly positive on prior bars—drops near zero. Two conditions match, and a bearish marker appears above the high: the push into the extremum lacks volume support.
-
Delta reversal at a low: Price makes a new low, but the bar closes with a positive delta as buyers absorb selling. Volume fades toward the low, and all three conditions are met. A marker in the delta reversal color appears beneath the low.
The author recommends using these markers near value area boundaries, session highs and lows, and the POC as an additional factor in your personal analysis.
Requirements
Requires footprint (cluster) data. Not suitable for spot Forex.
Pricing
$59.90 — one-time purchase.
Footprint-Lab is a developer of professional analytical tools and trading panels for ATAS. The company specializes in products for deep Order Flow analysis, volume profiling, and automated risk management. Their product lineup includes the JSI Pattern Research pattern backtesting system, the Pattern Runner live monitoring module, and the SFE TradingBoard interactive risk calculator. All Footprint-Lab solutions are built with zero "black box" code and fully integrate with ATAS charts and historical data.
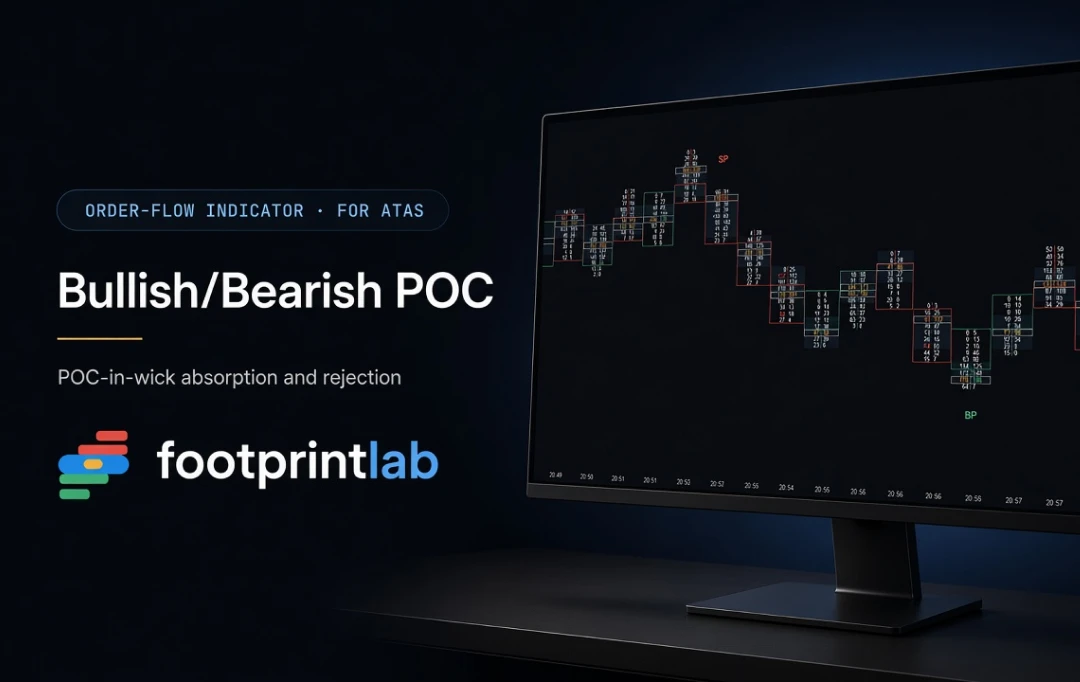
Automatically marks bars where Point of Control forms in the candle wick — signaling potential absorption and rejection. Displays BP/SP markers when met, plus Continuous-POC for high-volume accumulation levels.
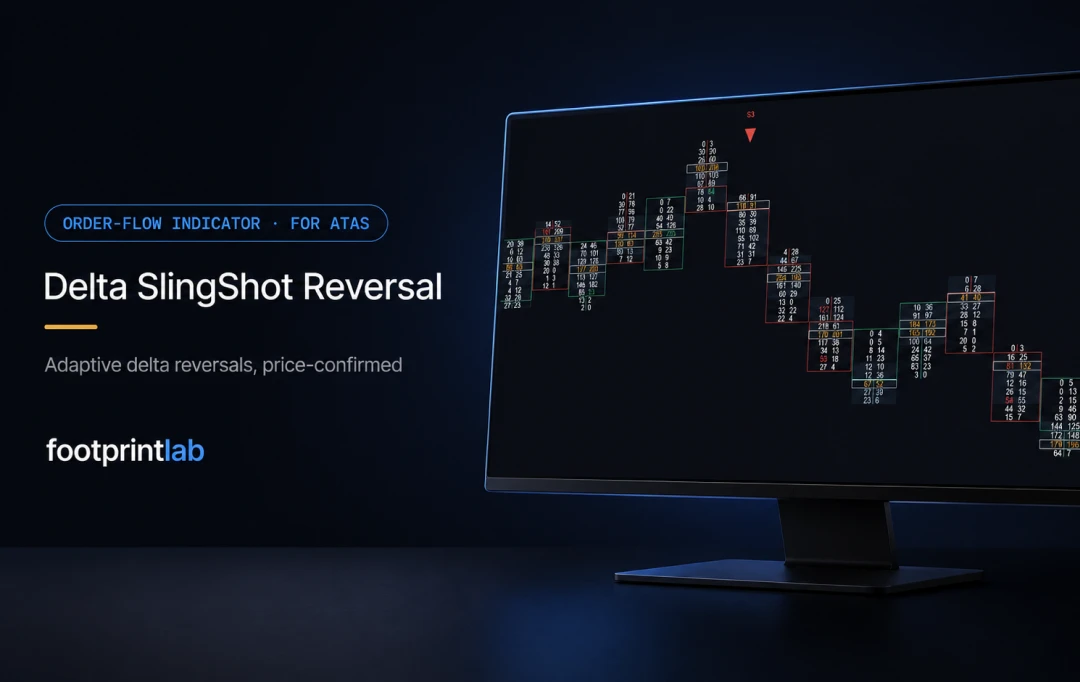
Adaptive delta reversal indicator marking sudden shifts in buyer/seller aggression via a self-calibrating band with price confirmation. Dynamic thresholds adjust automatically to session volatility instead of fixed values.
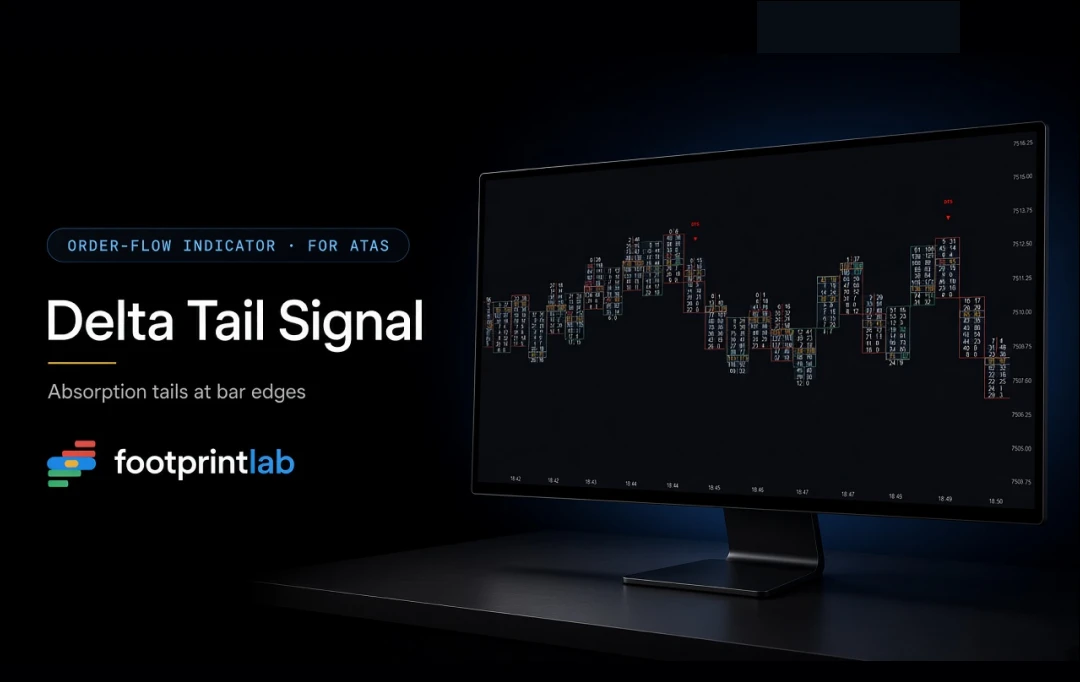
Marks closed bars with a micro-absorption pattern on the footprint: a narrow tail of opposing delta at the extremum and a uniform delta of the same sign within the body. Markers are non-repainting.
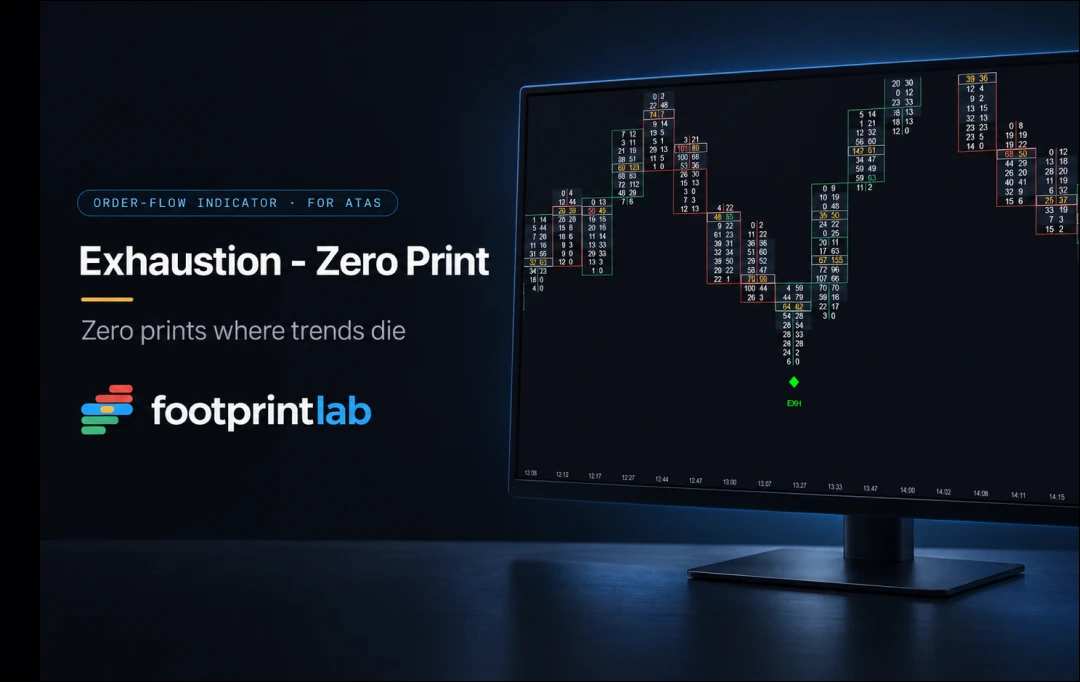
Marks bars with zero or near-zero volume on the extreme tick and a reversal candle following a series of trend bars. Calculated using the full footprint; volume threshold and trend length are configurable.
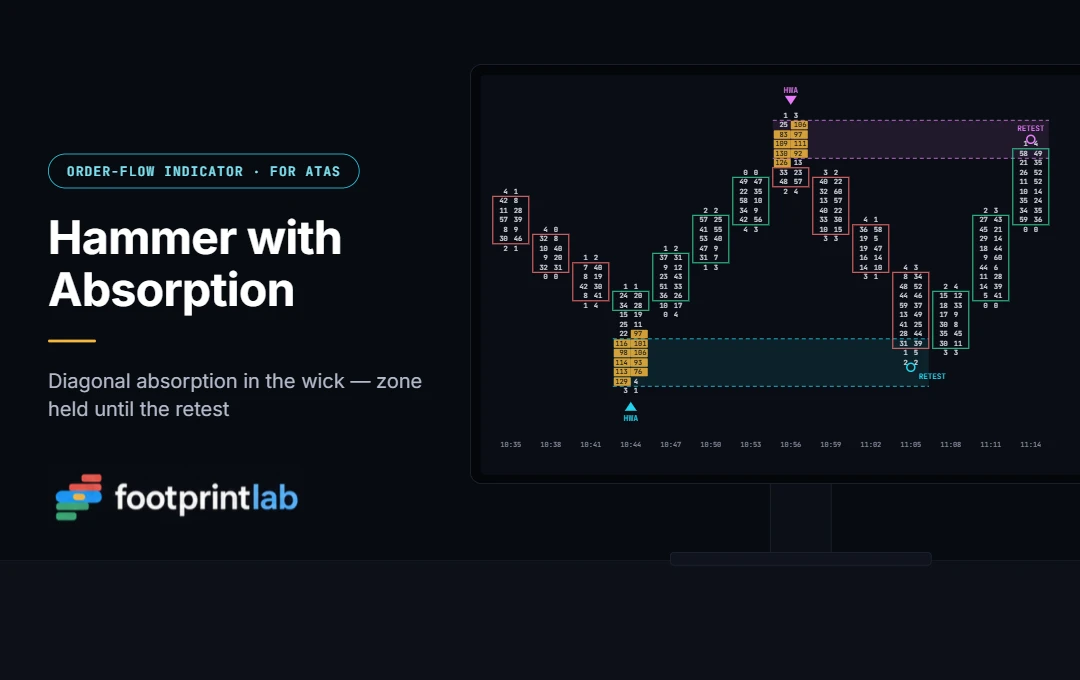
Marks hammers and inverted hammers only if the footprint shows a sequence of diagonal absorption within the long wick. The absorption zone extends to the right until retested.
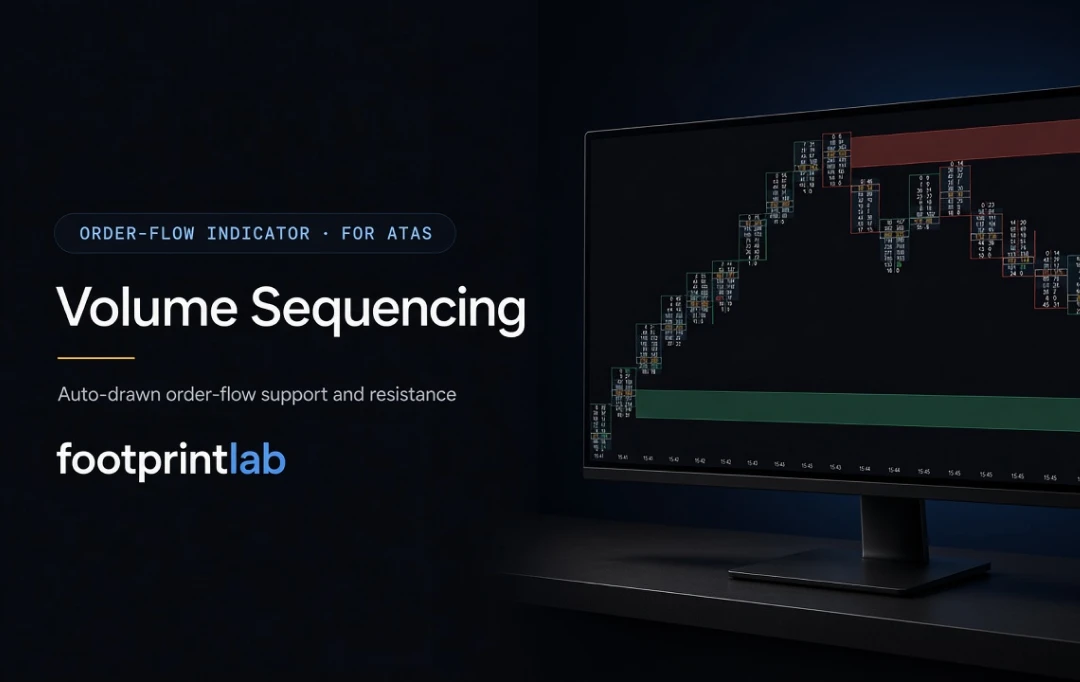
Automatically builds support/resistance zones where aggressive buyers or sellers stacked strictly increasing volume up the price ladder to an extreme. Turns manual footprint reading into clear, actionable zones that hold until tested.