
 Publication:06.11.2026
Exhaustion - Zero Print
- Category: Algotrading
- Asset class: Futures, Stocks, Cryptocurrencies
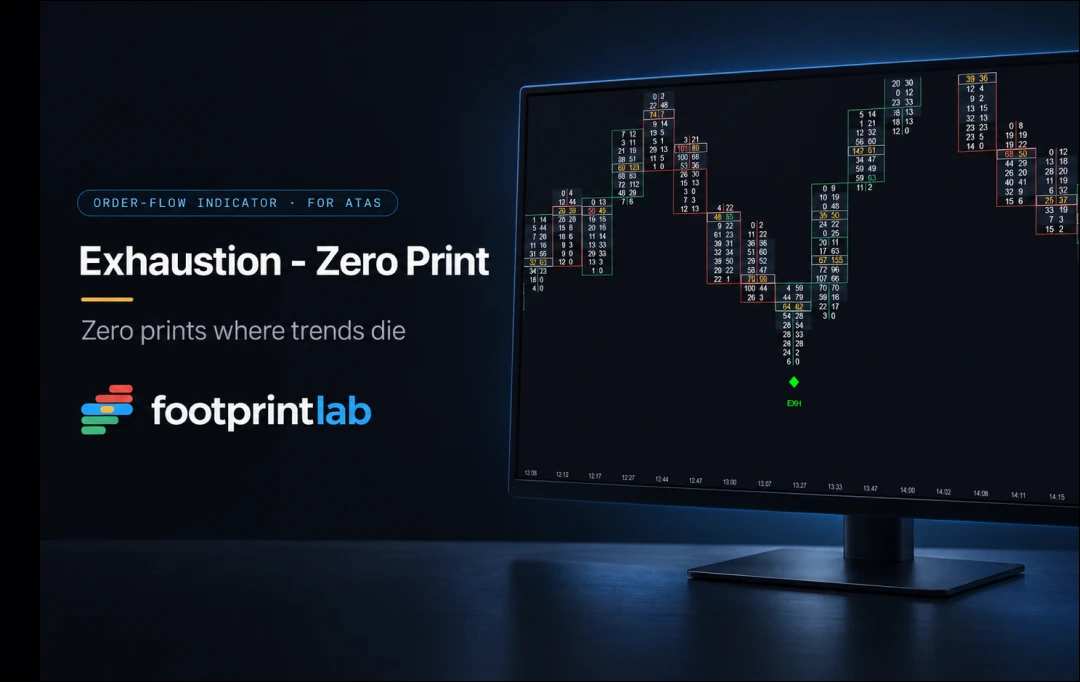
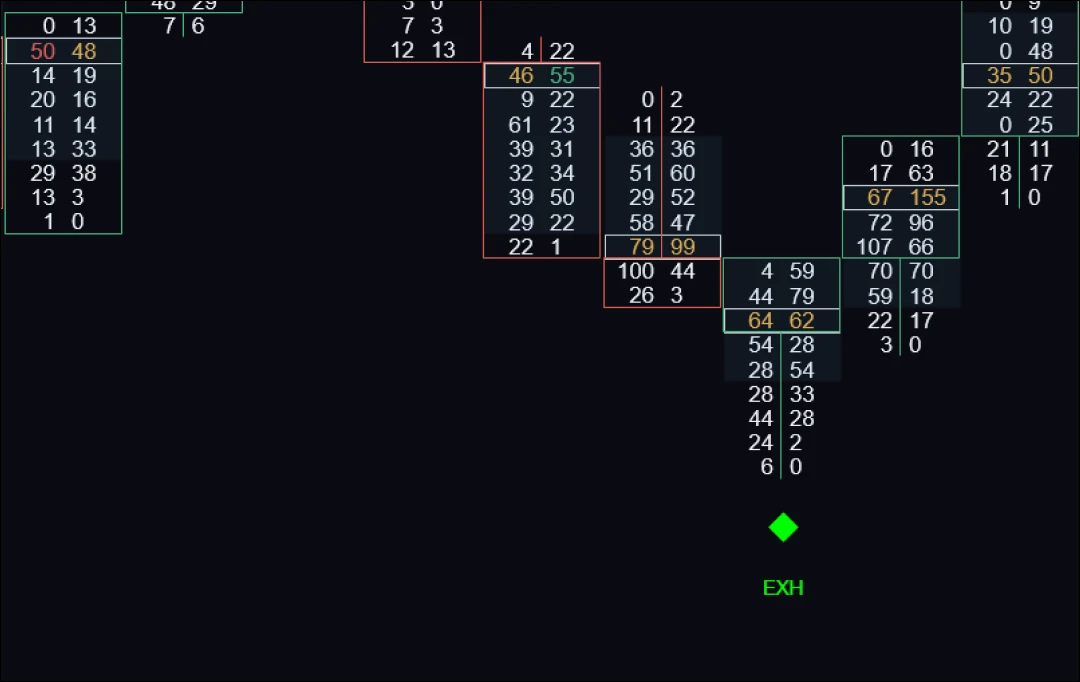
Description
Exhaustion - Zero Print is an indicator for ATAS footprint charts. It highlights bars with zero or near-zero volume at the extreme tick where the bar closes as a reversal candle following a sequence of directional bars. The indicator tracks the exact high and low of every bar so traders can visually pinpoint where aggressive activity dried up at the extremum. Assessing the significance for current price action remains up to the trader.
How the Indicator Works
-
Extreme Tick Analysis
On each bar, the indicator pulls the complete footprint (bid and ask at every price level) and identifies the top and bottom ticks of the range. If a price level is absent from the profile, it is treated as a zero print.
-
Bearish Marker Conditions
-
Ask volume at the top tick does not exceed the designated threshold
-
Bid volume at the top tick equals zero
-
The bar closed red (close below open)
-
Preceded by a series of strictly bullish candles
-
Bullish Marker Conditions
Mirrored at the low:
-
Zero ask volume
-
Bid volume at the bottom tick does not exceed the threshold
-
Green reversal candle
-
Preceded by a series of bearish candles
The required number of preceding trend candles is defined by the trader. Bars with a range of less than half a tick are skipped.
-
Chart Marker
If all conditions are met, the indicator places a colored shape marker or text label beyond the bar low (bullish case) or bar high (bearish case).
Key Features
-
Precise extreme tick validation: levels absent from the profile count as zero prints
-
Symmetric conditions for bullish and bearish markers
-
Customizable trend prerequisite to filter out signals during consolidation or flat markets
-
Adjustable volume threshold for the "thin" side of the extremum
-
Display modes: shape, text, or both; four marker types, with independent colors and labels for bullish and bearish signals
-
Historical calculation depth: configurable to recent bars or full history
Settings
-
Volume Threshold at Extreme: maximum volume allowed on the "thin" side of the extreme tick. Increase for highly active instruments, or decrease for stricter filtering
-
Prior Trend Bars Required: number of trend bars required prior to the reversal bar
-
Lookback Period: calculation depth (0 = full history)
-
Display Mode & Shape: Shape, Text, or both; Arrow, Diamond, Square, or Circle
-
Offsets & Sizes: tick offsets for shape and text, marker size, and font size
-
Labels & Colors: separate settings for bullish and bearish signals
Use Case Examples
-
ES, 2,000-contract footprint: Price moves up for three consecutive bars, then the next bar prints only a few ask contracts and zero bid contracts at the top tick before closing red. A red marker appears above the high: aggressive buying was virtually non-existent at the peak.
-
BTC, perpetual futures: Following several red candles, a bar shows zero ask volume and minimal bid volume at the lowest tick before closing green. A green marker appears below the low: aggressive selling was nearly absent at the bottom.
Markers appearing near swing highs or swing lows provide a clear context to inspect delta divergence, key levels, or absorption before making trading decisions.
Requirements
Requires per-tick bid/ask data. Not suitable for spot Forex.
Pricing
$59.90 — one-time purchase.
Footprint-Lab is a developer of professional analytical tools and trading panels for ATAS. The company specializes in products for deep Order Flow analysis, volume profiling, and automated risk management. Their product lineup includes the JSI Pattern Research pattern backtesting system, the Pattern Runner live monitoring module, and the SFE TradingBoard interactive risk calculator. All Footprint-Lab solutions are built with zero "black box" code and fully integrate with ATAS charts and historical data.
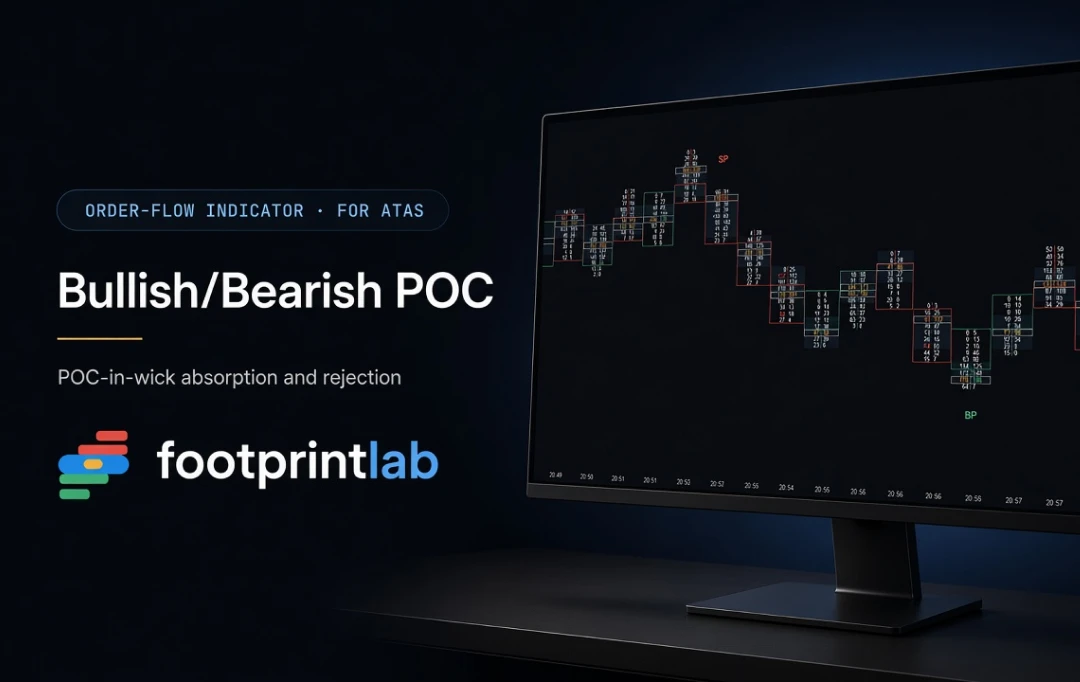
Automatically marks bars where Point of Control forms in the candle wick — signaling potential absorption and rejection. Displays BP/SP markers when met, plus Continuous-POC for high-volume accumulation levels.
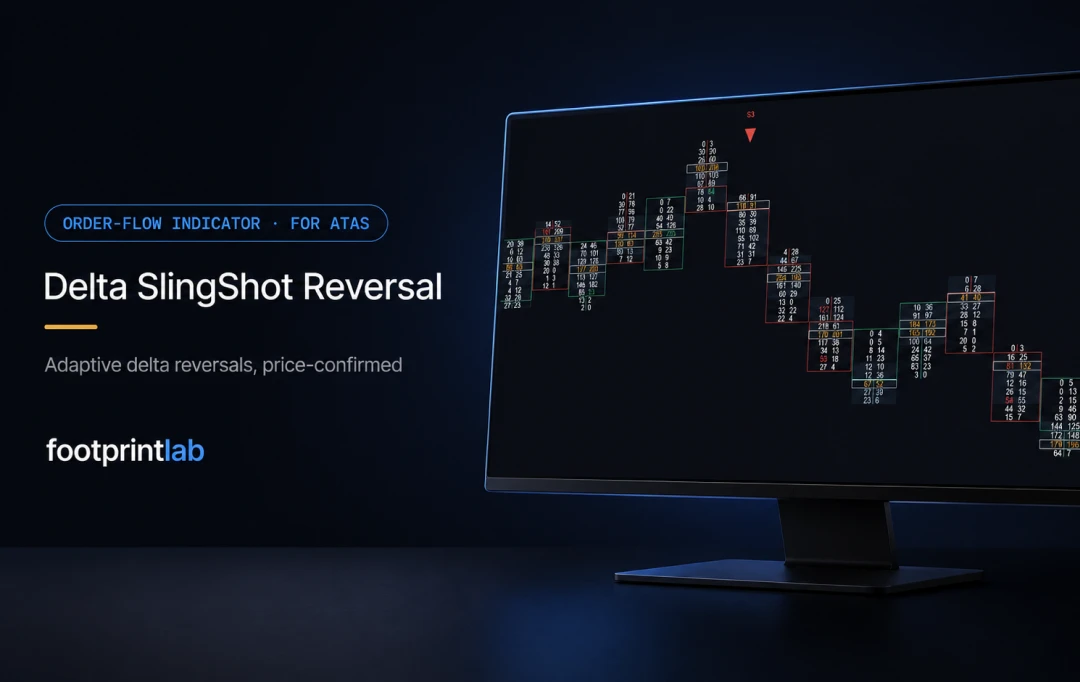
Adaptive delta reversal indicator marking sudden shifts in buyer/seller aggression via a self-calibrating band with price confirmation. Dynamic thresholds adjust automatically to session volatility instead of fixed values.
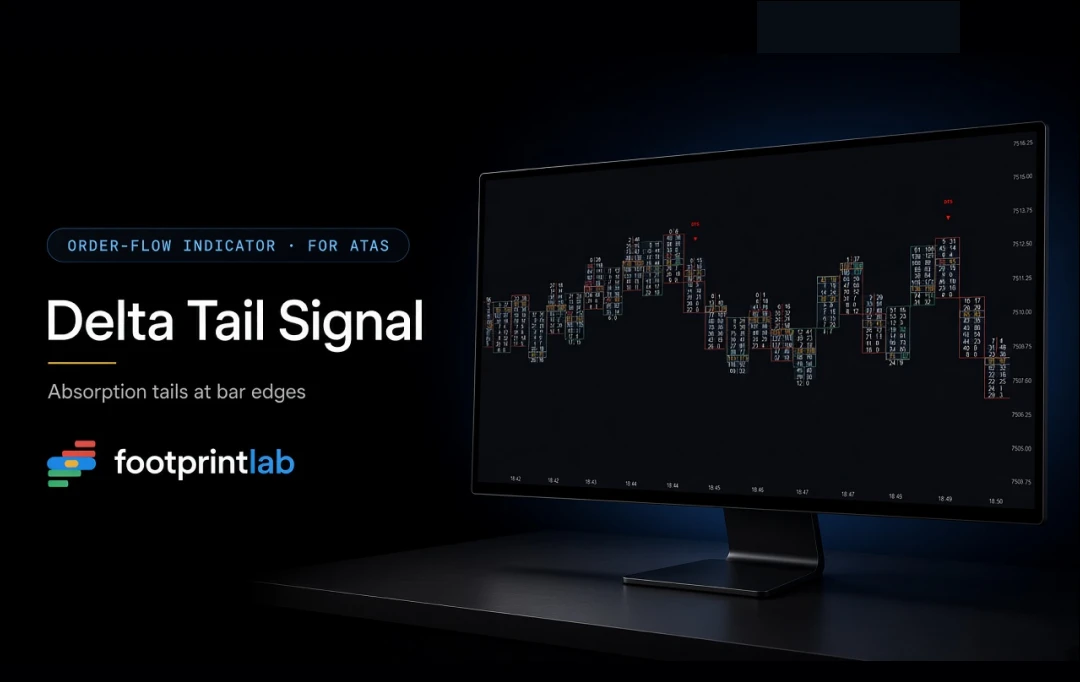
Marks closed bars with a micro-absorption pattern on the footprint: a narrow tail of opposing delta at the extremum and a uniform delta of the same sign within the body. Markers are non-repainting.
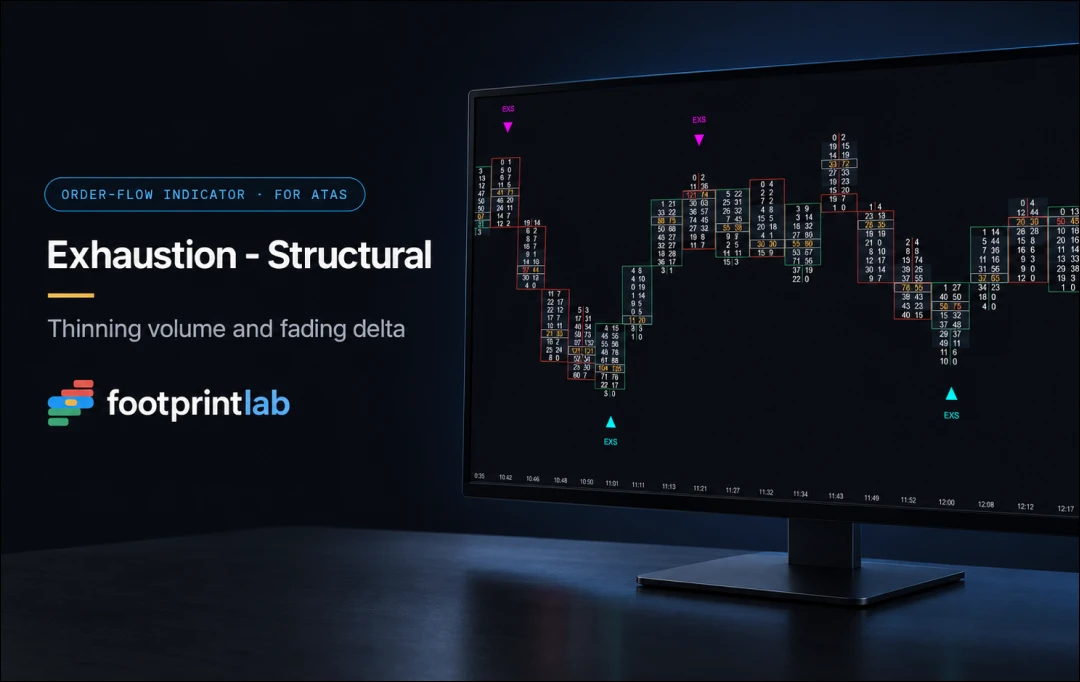
Marks new highs and lows with fading volume and weakening delta. A bar is marked only if at least two out of three conditions are met; thresholds adapt to each bar's volume.
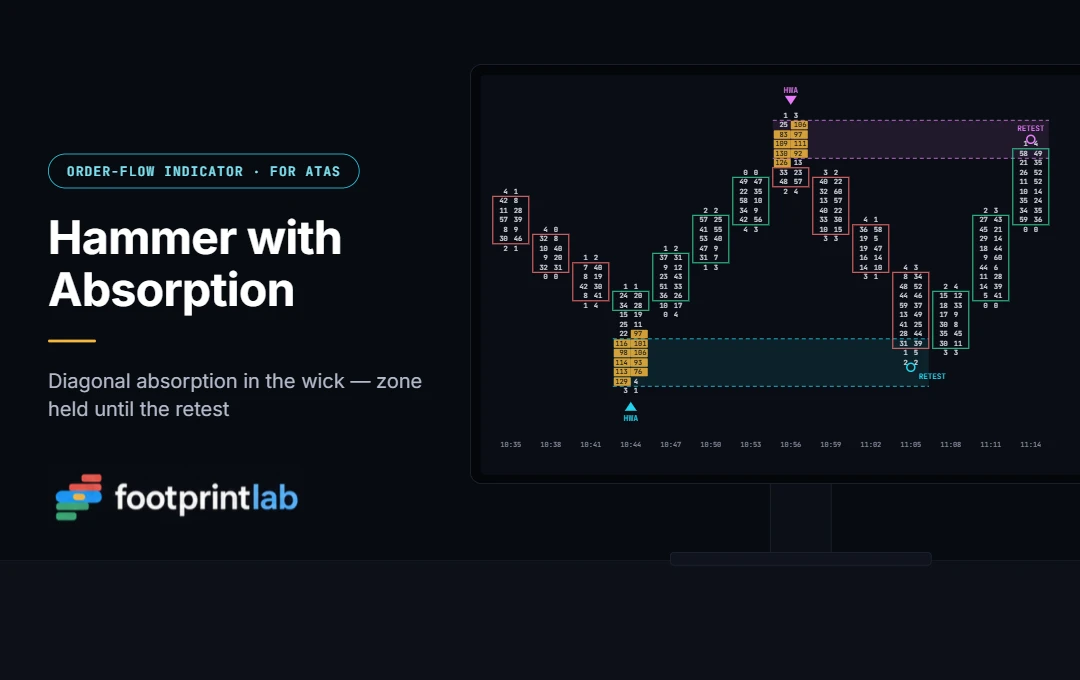
Marks hammers and inverted hammers only if the footprint shows a sequence of diagonal absorption within the long wick. The absorption zone extends to the right until retested.
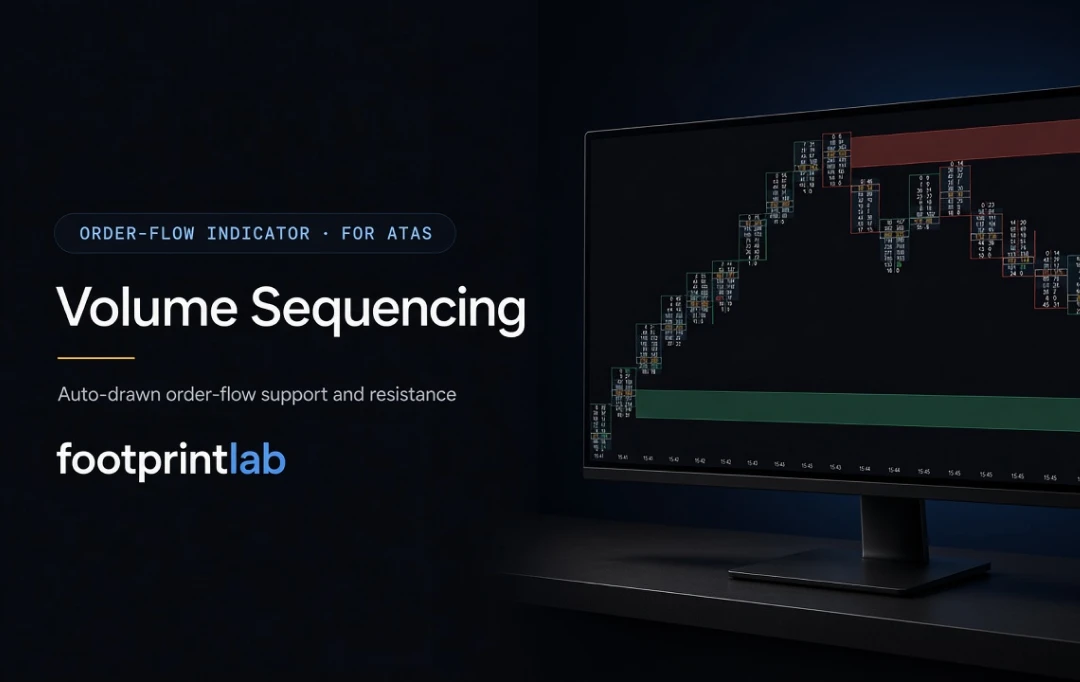
Automatically builds support/resistance zones where aggressive buyers or sellers stacked strictly increasing volume up the price ladder to an extreme. Turns manual footprint reading into clear, actionable zones that hold until tested.